Client Panel
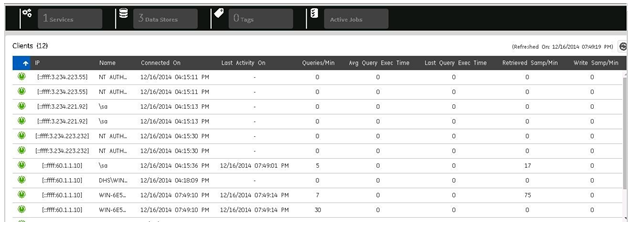
The Client panel in the Dashboard shows the details of all the connected clients in the system in the order of their fault levels.
Client Statistics
The Client Statistics panel displays data described in the following table:
| Field | Description |
|---|---|
| Connection | Indicates the status of the current connection. |
| Machine Name | The host name from where the client is connected. |
| Log-In User Name | The user name with which the client is connected. |
| Connected On | The date and time when the connection was established. |
| Last Activity | On The time when the last read and write request was made. |
| Queries/Min | The current rate at which the query requests are made. |
| Average Query Execution Time | The average time taken to execute a query. |
| Timed Out Reads | The number of timed out read requests made by clients. This counter increments when a query made by a client is taking longer time than "Max Query Time" or returning more samples than specified in the "Max Query Intervals". |
| Samples Written/Min | The current rate at which the data samples are written. |
| Details | Click this button to view more client details. To view all the clients, click the Show All Clients button. The All Clients page appears |
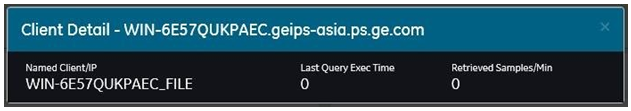
Client Details
This page, which is accessed from the Client Statistics panel in the dashboard, shows the following additional detail for a client.
| Field | Description |
|---|---|
| Named Client/IP | The name of the client or IP address from where the client is connected. |
| Last Query Exec Time | The time taken to execute the last query. |
| Retrieved Samples/Min | The current rate at which the data samples are received. For more information, refer to the Client Statistics topic. |