Configuration Panel
The Configuration page displays the current system status and performance statistics of Collectors and Clients, and allows configuration of the various components of the Historian system. This screen displays the data described in the following table.
| Field | Description |
|---|---|
| Services | Displays the number of services running. For more information, refer to the Configure Services section. |
| Data Stores | Displays the number of data stores configured in the system. For more information, refer to the Data Stores section. |
| Tags | The number of tags available with the data archiver. For more information, refer to the Tags section. |
| Active Jobs | Displays the number of current active jobs in the system. For more information, refer to the Jobs Page section. |
| Collectors | Displays the details of all the collectors available. For configuration of Collectors, refer to the Configure Collectors section. |
| Clients | Displays the details of all the clients present in the system. For more information, refer to the Clients section. |
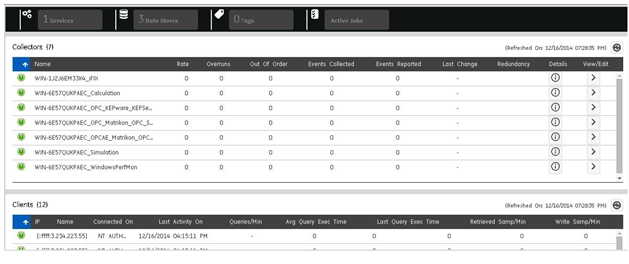
Configure Collectors
The Collectors panel in the Configuration page displays a mix of similar and additional data as the Dashboard, as described in the following table.
| Field | Description |
|---|---|
| Connection | Indicates the status of the current connection. "Running" indicates that the collector is operating. "Stopped" indicates that it is in pause mode and not collecting data. "Unknown" indicates that status information about the collector is unavailable at present, perhaps as a result of a lost connection between the collector and server. |
| Name | The collector ID, which is used to identify the collector in an Historian system. |
| Rate | The current rate in number of samples/minute at which the server is receiving data from the collector. It is a measure of the collection rate and also of data compression activity. A value equal to the data acquisition rate, when Collector Compression Percent is zero, indicates that every data value received from the data source is being reported to the server. This means that the collector is not performing any data compression. You can lower the report rate, and make the system more efficient, by increasing the data compression at the collector. To do this, widen the collection compression deadbands for selected tags. |
| Overruns | The overruns in relation to the total events collected since startup. This value is calculated by using the following equation: OVERRUN_PCT = OVERRUNS / ( OVERRUNS + TOTAL_EVENTS_COLLECTED ) Overruns are a count of the total number of data events not collected on their scheduled polling cycle. In a normal operation, this value should be zero. You may be able to reduce the number of overruns on the collector by increasing the tag collection intervals (per tag). |
| Out of Order | The number of samples within a series of timestamped data values normally transmitted in sequence that have been received out of sequence since collector startup. This field applies to all collectors. Even though events are still stored, a steadily increasing number of out of order events indicates a problem with data transmission that you should investigate. For example, a steadily increasing number of out of order events when you are using the OPC Collector means that there is an out of order between the OPC Server and the OPC Collector. This may also cause an out of order between the OPC Collector and the data archiver but that is not what this statistic indicates. |
| Events Collected | Counts the total number of events collected from the data source by the collector. |
| Events Reported | Counts the total number of events reported to the Historian archive from the collector. This number may not match the Total Events Collected field due to collector compression. |
| Last Change | The timestamp when the last collection happened. |
| Redundancy | Displays the current redundancy status of the collector. "Active" state indicates that the collector is currently collecting data and "Standby" indicates that the collector is the standby for the primary collector. Note: This status will be displayed only when the Redundant Collector property of the collector is Enabled. |
| Details | Click this button to view the Collector Detail Diagnostics. . |
| View/Edit | Click this button to examine or modify configuration parameters for any collector in your system. For more information, refer Collector Details Page. |
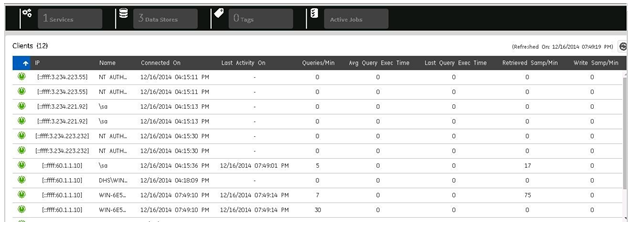
Configure Clients
This page shows all clients in the system. For more information on the fields, refer to the field and description table in the Client Statistics topic.