Historian
Handle Value Step Changes with Collector Data Compression
Note: Individual tags can be configured to retrieve step value changes.
If you enable collector compression, the collector does not send values to the archiver any new input values if the value remains within its compression deadband. Occasionally, after several sample intervals inside the deadband, an input makes a rapid step change in value during a single sample interval. Since there have been no new data points recorded for several intervals, an additional sample is stored one interval before the step change with the last reported value to prevent this step change from being viewed as a slow ramp in value. This value marks the end of the steady-state, non-changing value period, and provides a data point from which to begin the step change in value.
The collector uses an algorithm that views the size of the step change and the number of intervals since the last reported value to determine if a marker value is needed. The following is an example of the algorithm:
BigDiff=abs(HI_EGU-LO_EGU)*(CompressionDeadbandPercent/(100.0*2.0))*4.0
If ( Collector Compression is Enabled )
If ( Elapsed time since LastReportedValue>=( SampleInterval * 5 ) )
If ( abs(CurrentValue-LastReportedValue) > BigDiff )
Write LastReportedValue,Timestamp=(CurrentTime-SampleInterval) Note: These settings are also adjustable from the Registry. Please contact technical support for more information.
Value Spike with Collector Compression
For example, a collector reads a value X once per second, with a compression
deadband of 1.0. If the value of X is 10.0 for a number of seconds starting at
0:00:00 and jumps to 20.0 at 0:00:10, the data samples read would be:
| Time | X Value |
|---|---|
| 0:00:00 | 10.0 (steady state value) |
| 0:00:01 | 10.0 |
| 0:00:02 | 10.0 |
| 0:00:03 | 10.0 |
| 0:00:04 | 10.0 |
| 0:00:05 | 10.0 |
| 0:00:06 | 10.0 |
| 0:00:07 | 10.0 |
| 0:00:08 | 10.0 |
| 0:00:09 | 10.0 |
| 0:00:10 | 20.0 (new value after step change) |
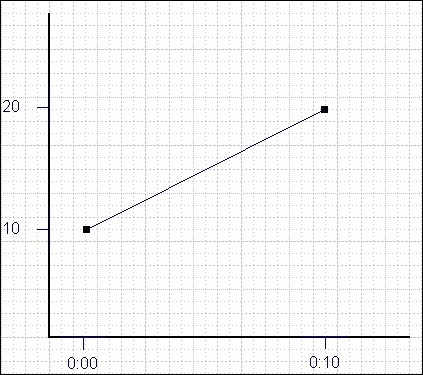
To increase efficiency, the straightforward compression would store only 2 of these
11 samples.
| Time | X Value |
|---|---|
| 0:00:00 | 10.0 (steady state value) |
| 0:00:10 | 20.0 (new value after step change) |
However, without the marker value, if this data were to be put into a chart, it would
look like the data value ramped over 10 seconds from a value of 10.0 to 20.0,
as shown in the following chart.
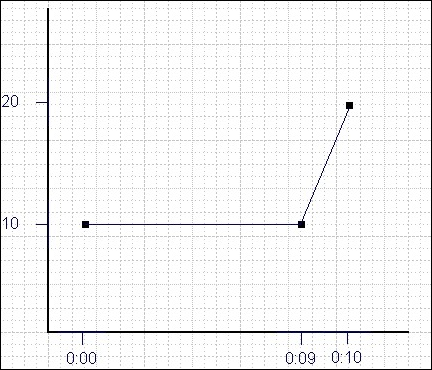
The addition of a marker value to the data being stored results in the
following data values:
| Time | X Value |
|---|---|
| 0:00:00 | 10.0 (steady state value) |
| 0:00:09 | 10.0 (inserted Marker value) |
| 0:00:10 | 20.0 (new value after step change) |
If you chart this data, the resulting trend accurately reflects the raw data and
likely real world values during the time period as shown in the following chart.