 Historian
Monitor Historian Health and Status
- Monitor Operating System Event Files
- Monitor Collector Status Tags
- Monitor Historian Subscriptions
- Use Collector Status Tags
- Subscribe to Historian Alerts and Messages
- Create Subscriptions
Monitor Operating System Event Files
You can view the operating system event files through the Event Viewer. For more information on accessing the Event Viewer, refer to Review System Alerts and Messages. The operating system event files contain the Historian Status messages found in the application log. Entries in that file are similar to those found in the Alerts panel, but may contain multiple entries for certain items. Multiple entries occur as a result of distributing the components of Historian. Each component logs its critical status changes to the local event log. For example, a collector and the data archive will both log a collector going off-line.
Monitor Collector Status Tags
- Rate Output - The number of events per minute the collector processes.
- Status Output - The status of the Collector as either Running or Stopped.
- Heartbeat - Allows the data source to verify that the collector is working. The collector writes a value of one to this address once a minute.
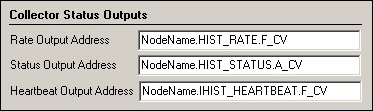
The three tags referenced correspond to tag names within the SCADA node FIX.
- NodeName.HIST_RATE.F_CV – An AI block. The F_CV field gives the number of events per minute that the collector is reporting to the server.
- NodeName.HIST_STATUS.A_CV – A text block. The A_CV field displays a status such as Running or Stopped depending on the status on the collector. This field does not reflect whether or not the Collector program is running.
- NodeName.HIST_HEARTBEAT.F_CV – A digital alarm block that will alarm if the F_CV field remains OPEN for more than 60 seconds. The iFIX collector closes the F_CV field every 60 seconds. You must use a pro- gram block in conjunction with this block to automatically OPEN the block if it has been CLOSED. This provides for a momentary reset of the 60 second alarm timeout. Unlike the HIST_STATUS block that only updates the Collector status if the collection stops, the HIST_ HEARTBEAT detects that the collection has stopped or that the Collector application is no longer running.