Line Chart
In a line chart, data points are connected by a line to help visualize the changes in data trends over a period a time.
| Operations Hub Classic Layout | Refer to About Widgets (Classic) |
| Operations Hub New Layout | Refer to Visuals Tab |
Line Chart Properties
| Field Name | Description |
|---|---|
| Line Type | Select from the available list of chart line types. |
| Source > Data Source | Provide the input data source to receive values for the chart. |
| Use Raw Format | Select the check box to display numbers in raw format. For example, a numeric value with 5 or more decimal places is shown as it is, and not rounded off. |
| Number of decimals | This option appears if you do not want to display numbers in raw
format. In that case, enter the decimal places (0-7) to consider after the decimal point to format large numbers. Based on the decimals, the value is rounded off to the nearest whole number. |
| Title | Title name for the chart. |
| Subtitle | Subtitle name for the chart. |
| Y Axis Title | Title name for y-axis. |
| Y Axis Limits | Select the check box for Enable Limits if you want
to define a data range for the Y-axis of a line chart. By setting the minimum (Min) and maximum (Max) values for the Y-axis, you can ensure that the line chart shows data within that range, which can be useful for highlighting specific trends or patterns within the data. Enter values for the following fields:
|
| X Axis Title | Title name for x-axis. |
| X Axis Mode | Format the x-axis:
|
| X Axis Rotation | If you choose to rotate labels, enter the degree of rotation. |
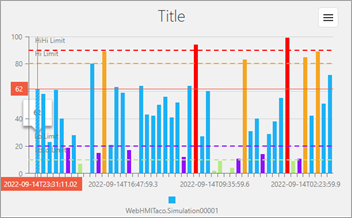
| Enable Line Limits | Select/Clear the check box to show/hide line limits. If you choose to show line limits at runtime, then enter the HiHi, Hi, Lo, LoLo limit values. |
| Labels External | Enables external labels for the limits. |
| HiHi Label | Enter a label name for HiHi limit. |
| HiHi | Use the available options to configure the source values. Refer to Bind Your Data to Plug-ins. |
| HiHi Color | Select a HiHi line color. |
| Hi Label | Enter a label name for Hi limit. |
| Hi | Use the available options to configure the source values. Refer to Bind Your Data to Plug-ins. |
| Hi Color | Select a Hi line color. |
| Lo Label | Enter a label name for Lo limit. |
| Lo | Use the available options to configure the source values. Refer to Bind Your Data to Plug-ins. |
| Lo Color | Select a Lo line color. |
| LoLo Label | Enter a label name for LoLo limit. |
| LoLo | Use the available options to configure the source values. Refer to Bind Your Data to Plug-ins. |
| LoLo Color | Select a LoLo line color. |
| Legend | Select the Visible check box if you want to show
the chart legend. You can also use the vertical/horizontal options to position the legend in the chart. |
| Crosshair | Select the check box if you want to show the crosshairs in the chart. |
| Show Points | Select the check box if you want to show data points in the chart. |
| Point Symbol | Select from the available list of symbols to represent the points in the chart. |
| Stacking |
|
| Truncate X-Axis | Select the check box to truncate the x-axis labels. |
| Hidden | Select this check box if you want to hide the
plug-in. To show the hidden plug-in in Operations Hub new layout, go
to Page Visuals and under
Action column, select |
Configuring Source Values for Line Charts
When configuring a line chart using an extension query, the data retrieved from the data source is automatically arranged in the following manner: first, the Timestamp, followed by the Value, and then the Name.
- Timestamp: This data is used for the X-axis.
- Value: This data is used for the Y-axis.
- Name: This data is used for legend labels.
- Timestamp/Week for the X-axis
- Value for the Y-axis data
- Name for the legend
Chart Line at Runtime
+ for
timestamp.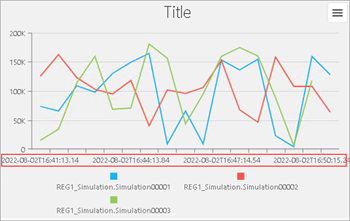
- for
timestamp.