Control Loop Performance Monitoring Overview
What is Process Control?
Process control is an engineering discipline for maintaining the output of a specific process within a desired range.
A control system is a device or set of devices used to manage the behavior of other devices or systems in an industrial process facility.
What is a Control Loop?
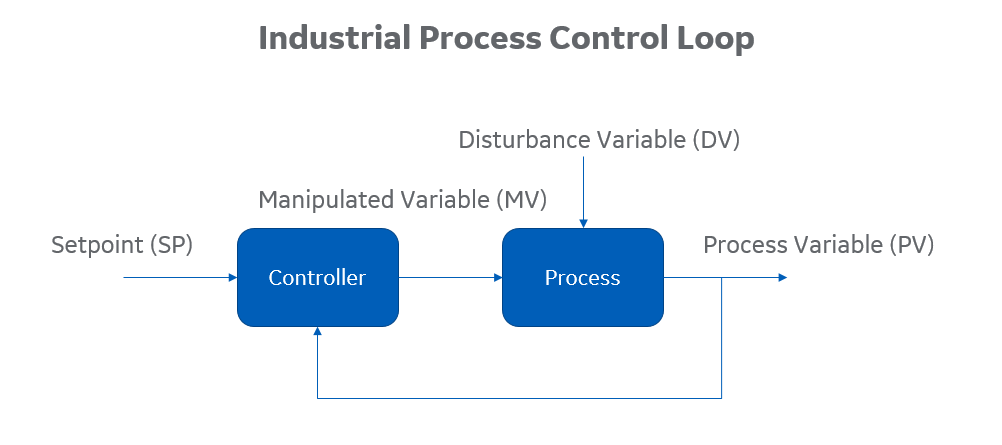
A control loop is the fundamental building block of industrial control systems. It consists of all the physical components and control functions necessary to automatically adjust the value of a measured Process Variable (PV) to equal the value of a desired Setpoint (SP).
A control loop includes the process sensor, the controller function, and the Final Control Element (FCE), all of which are required for automatic control.
The difference between the SP value and the current value of the PV is called the Error, and this is used by the control algorithm to calculate adjustments to the Manipulated Variable (MV). The MV is sent to the FCE (also referred to as the actuator) to bring the PV back to the SP value, using a closed loop feedback mechanism. This mechanism allows control systems to adapt to varying process operating circumstances and disturbances. Disturbances can sometimes be measured and compensated for by means of a Disturbance Variable (DV).
What is a PID Control Loop?
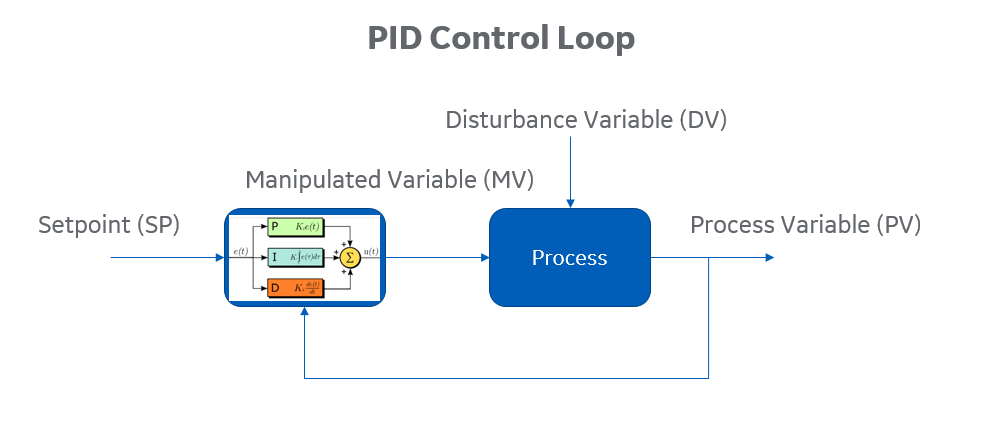
A PID control loop is a generic control loop feedback mechanism that uses a well-known PID(F) algorithm. It is very common in industrial control systems.
The PIDF (Proportional–Integral–Derivative-Filter) control algorithm involves four separate tuning constant parameters:
- Proportional value (P)
-
The variable control required in proportion to the current needs of the system.
-
- Integral value (I)
- The integral control that applies ever-increasing control actions, until the error is reduced to zero.
- Derivative value (D)
-
The derivative value of the algorithm is determined by how quickly the error changes over time.
-
- Filter value (F)
- Adding a filter (F) to the PID controller helps to remove noise signals from the system and enables better control under some conditions.
Many different implementations (variations) of the PID(F) algorithm are used in industry today.
What is PID Control Loop Tuning?
When a disturbance to the process occurs, the task of the controller is to reduce the error signal to zero and restore the PV back to the SP value, as effectively, efficiently, and quickly as possible. Choosing the right PIDF values for the parameters in the PIDF controller algorithm allows the controller to achieve this goal in the most effective way possible. This is referred to as loop tuning: selecting the best PIDF values to get the most accurate and effective control loop performance behavior. If the loop is tuned properly, the response time to disturbances is reduced. If the loop is tuned too aggressively, cycling and overshoot of the setpoint value may occur.
What is Control Loop Performance Monitoring?
Control Loop Performance Monitoring (CLPM) provides a solution to monitor the performance of an enterprise fleet of industrial process control loops, to detect and identify underperforming control loops, and to help to diagnose control loop problems.
Industrial process plants typically have hundreds or thousands of control loops configured inside PLC (Programmable Logic Controller), DCS (Distributed Control System), and SCADA (Supervisory Control and Data Acquisition) systems to automate and control plant operations.
Control Loops are located at the interface between equipment and process. They also operate industrial equipment to form an industrial process.
The stability, reliability, and optimal performance of an industrial process is dependent on the stability and performance of the fleet of control loops used to operate and control that process. Industrial process plants are also capital-intensive assets. Suboptimal control loops can directly impact equipment reliability, equipment lifetime, and operational performance.
It is therefore essential to manage the performance of control loops as valuable assets in an industrial enterprise facility that should be continuously monitored and optimized.
Evaluating Control Loop Performance
- Control loops are performing well when the monitored process variable (PV) varies within the defined upper and lower control limits from the desired SP value.
- Control loops are performing poorly where the monitored PV functions outside of the desired process control limits.
The Asset Model in CLPM
The asset model is central to CLPM in a number of ways:
- Loops are defined as assets, according to a predefined template/definition for a control loop.
- Deployment of data collections in Edge Analytics is driven by the asset model.
- CLPM configuration is driven from the asset.
- Loop thresholds and control limits are defined on the asset.
- Edge data is extracted from the asset.
- Actions on a control mode are defined on the asset.
Consult the Control Loop Asset Definition for details.
CLPM Components
CLPM is made up of the following components working together.
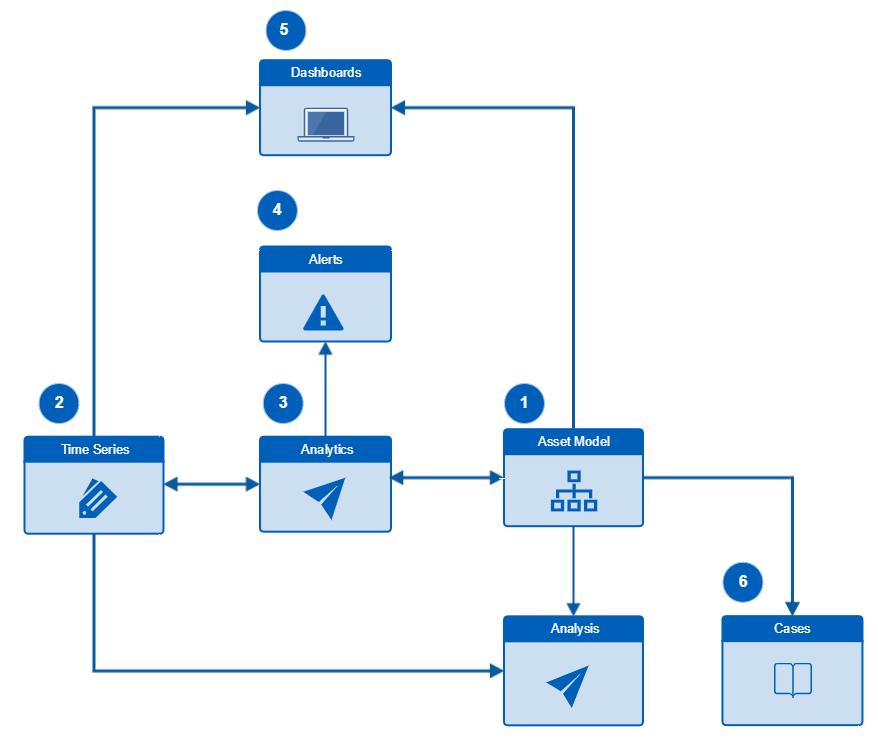
These components enable the following functionality.
- Loops are defined as assets, according to a predefined template for a control loop.
- Selected tags are collected into TimeSeries for each loop.
- Loop analytics are deployed.
- Alerts produced by these analytics are triggered under conditions defined in analytic configuration.
- Data produced by these analytics is viewed via the Fleet Dashboard and Loop Dashboard.
- Issues identified with loops (cases) are resolved.
User Workflow in CLPM
Following the CLPM workflow / process described below helps users monitor and optimize the performance of an enterprise fleet of control loops. Underperforming control loops can be identified, prioritized, and optimized.
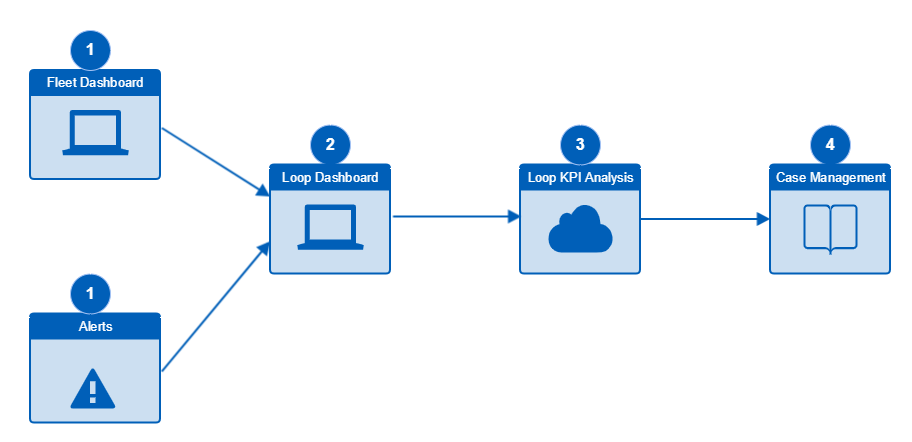
1. The Fleet Dashboard
Use the Fleet Dashboard to rank the performance of all control loops contained in any level of an enterprise asset model (Enterprise, Segment, Site, etc.) over a specified time period. This helps in identifying underperforming control loops and prioritizing them for optimization. Consult the Fleet Dashboard section of this documentation for details.
OR
1. Alerts
Alerts notify you about potential problems with control loops. Consult the section of this documentation on deploying CLPM analytics for details on analytics that trigger alerts and how to configure them.
2. The Loop Dashboard
Use the Loop Dashboard to visualize the performance of any individual control loop in detail over a specified time period. This helps in assessing control loop performance and diagnosing potential causes of suboptimal performance. Consult the Loop Dashboard section of this documentation for details.
3. Loop KPI Analysis
Analyze the historical performance of loop KPIs over any historical time period to gain further insight. Loop KPIs can be assessed in relation to other loop KPIs or compared with the same loop KPIs calculated using other data and other tags available in Predix TimeSeries. Consult the KPI Reference for CLPM for more on loop KPIs.
4. Case Management
Action, collaborate on, and resolve any issues identified with control loops. Consult the Application Analytics documentation for details.
CLPM Terminology
The following terms are frequently used in control loop performance monitoring (CLPM).
| Term | Description |
|---|---|
| CLPM | Control Loop Performance Monitoring |
| PV (Process Variable) | This is the measured process variable, reflecting the actual state of the process that is being controlled. |
| SP (Setpoint) | This is the desired value (target value) to which the PV is controlled. |
| Error | This is the difference between the PV and SP. It is calculated as Error = PV-SP. Note that this is not an absolute value. |
| Controller | The subsystem containing the control algorithm that manipulates the MV to control the PV to the SP. |
| MV (Manipulated Variable) | The variable manipulated (adjusted) by the controller to control the PV to the SP. |
| DV (Disturbance Variable) | A measured disturbance variable that can be used by the controller to compensate for the impact of the disturbance on the PV. |
| P (Proportional Value) | Normally the Proportional Gain value of the PID controller. |
| I (Integral Value) | Normally the Integral Gain value of the PID controller. |
| D (Derivative Value) | Normally the Derivative Gain value of the PID controller. |
| F (Filter Value) | Normally the Filter Time Constant value of the PID controller. |
| Final Control Element (FCE)/ Actuator | The device that is physically affected by a change in the MV so as to have an impact on the process. |