Get Started with CLPM
Getting Started with CLPM
This section provides instructions for getting started with CLPM.
At the high level, this involves the following steps, to be performed by the CLPM solution administrator.
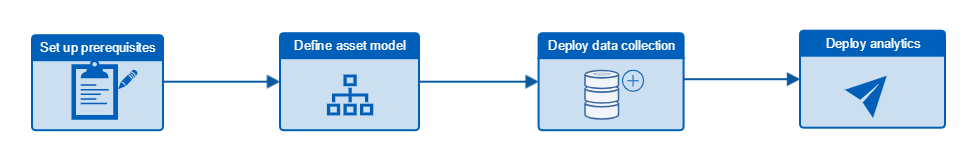
Prerequisites for CLPM
To get started with CLPM, first ensure that you have met these prerequisites.
Tenancy Requirements
Ensure that your OPM application instance has the following apps and services set up:
- Application Analytics
- The Asset Model Service
- The Time Series Service
- The Dashboard Service
- Predix Event Hub
- Predix Insights
- KPI Management
- Analysis Service
- Alert Service
Analytics Requirements
Ensure that you have access to the CLPM analytics in the Analytics Catalog.
Browser Requirements
Only the Chrome 43 or higher browser is supported for accessing the Loop and Fleet Dashboards.
Define the Asset Model
Construct the asset ingestion file required by Application Analytics and perform asset ingestion.
The asset ingestion files (there can be several files or they can be combined into one) are JSON files that specify customer assets and their hierarchical structure or asset model. In the context of CLPM, the assets in this file are control loops that together define an industrial control system.
The basic structure of the files is as outlined in the APM Assets documentation for asset ingestion.
In addition to the required attributes that are standard for all such files, files describing control loop assets require custom attributes defined in the Control Loop Asset Definition for CLPM that you need to specify.
To define the asset model, carefully follow the instructions given with the Control Loop Asset Definition for CLPM.
Deploy Data Collection
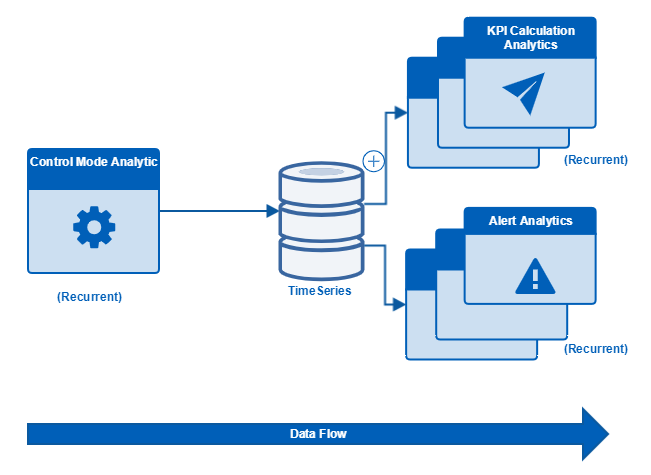
Collect data into TimeSeries for all the analytic input tags as defined in your asset model. The recommended rate for data collection is every 5 seconds or slower.
Once you have set up data collection, you are ready to set up control mode logic.
Set Up Control Mode Logic
Set up control mode logic for CLPM by creating and deploying your Control Mode Analytic. Use the Python example provided here to create a Predix Insights-based analytic.
What Is the Control Mode Analytic?
CLPM analytics require an input tag that describes the current control mode for each loop. The control mode tag must contain values of type double and must be one of the following:
| Tag Value | Description |
|---|---|
| 1 | A tag value of 1 indicates a control loop that is currently operating manually. The controller is not controlling the process. |
| 2 | A tag value of 2 indicates a control loop where the process is currently being controlled by the controller. |
| 3 | A tag value of 3 indicates a controller that is currently set to CASCADE. |
| 4 | A tag value of 4 indicates a process that is currently shut down. Note: Most KPIs will not be calculated for this control mode. |
CLPM provides an example Predix Insights analytic to get you started towards developing your own control mode analytic. The resulting analytic will vary depending on your available data, but each control mode analytic must produce a result that matches one of the tag values in the table above.
Example Control Mode Analytic
'''
Created on Aug 30, 2018

@author:
'''
from pyspark.sql import SparkSession
from pyspark.sql import *
from pyspark.sql import functions
from pyspark.sql.types import *
from pyspark.sql.dataframe import *
from pyspark.sql.functions import *
import sys
import time
from datetime import datetime

class ControlModeScript():
    # ################ DO NOT EDIT ########################
    MANUAL = "1.0"
    AUTO = "2.0"
    CASCADE = "3.0"
    SHUTDOWN = "4.0"
    QUALITY_GOOD = "3"
    QUALITY_BAD = "0"
    # ################ END ########################

    # ################ MODIFY THIS FUNCTION ########################
    # When modifying this function, TQVs for the custom tags (Tag_VV, Tag_XX, Tag_YY, Tag_ZZ) can be obtained as follows:
    #     * timestamp is common amongst all tags
    #     * quality_XX is quality of Tag_XX, quality_YY is quality of Tag_YY and so on
    #     * value_XX is value of Tag_XX, value_YY is value of Tag_YY and so on
    #
    def control_mode_query(self):

        # The example SQL query below does the following:
        # select timestamp as the timestamp of the tag
        # always select quality as good
        # if quality is bad
        #    select value as shutdown
        # else if value of tag_XX is 1
        #    select value as MANUAL
        # else if value of tag_YY is 1
        #    select value as AUTO
        # else if value of tag_ZZ is 1
        #    select value as CASCADE
        # else
        #    select value as SHUTDOWN
        string = "timestamp as timestamp, CASE WHEN quality_XX != 3 OR quality_YY != 3 OR quality_ZZ != 3 OR quality_VV != 3 THEN " + self.SHUTDOWN
        string += " WHEN value_XX = 1 THEN "+self.MANUAL+" WHEN value_YY = 1 THEN "+self.AUTO+" WHEN value_ZZ = 1 THEN "+self.CASCADE+" WHEN value_VV = 1 THEN "+self.SHUTDOWN+" ELSE "+self.SHUTDOWN+" END as value," + self.QUALITY_GOOD +" as quality"
        return string
    # ################ END ########################

    # ################ DO NOT EDIT ########################
    def run_job(self, spark_session, runtime_config, job_json, context_dict, logger):
            try:
                spark = spark_session
                logger.info("Starting analytic...")
                configContext = context_dict["configDS"]
                tsContext = context_dict["timeseriesReadDS"]
                configDF = configContext.sql("select * from " + context_dict["configDS"].table_name)
                configDF.createOrReplaceTempView("configDF")
                tsDF = tsContext.sql("select * from " + context_dict["timeseriesReadDS"].table_name)
                tsDF.createOrReplaceTempView("timeseriesReadDF")

                Tag_XXDDF = tsContext.sql("SELECT c.AssetSourceKey as asset, t.timestamp as timestamp, t.value as value_XX, t.quality as quality_XX FROM `timeseriesReadDF`"
                    + " t JOIN `configDF` c on t.tag = c.MappingValue WHERE c.MappingKey = 'Tag_XX' DISTRIBUTE BY asset")
                Tag_XXDDF.createOrReplaceTempView("tag_XXDDF")


                Tag_YYDDF = tsContext.sql("SELECT c.AssetSourceKey as asset, t.timestamp as timestamp, t.value as value_YY, t.quality as quality_YY FROM `timeseriesReadDF"
                                             + "` t JOIN `configDF` c on t.tag = c.MappingValue WHERE c.MappingKey = 'Tag_YY' DISTRIBUTE BY asset")
                Tag_YYDDF.createOrReplaceTempView("tag_YYDDF")

                Tag_ZZDDF = tsContext.sql("SELECT c.AssetSourceKey as asset, t.timestamp as timestamp, t.value as value_ZZ, t.quality as quality_ZZ FROM `timeseriesReadDF"
                                             + "` t join `configDF` c on t.tag = c.MappingValue WHERE c.MappingKey = 'Tag_ZZ' DISTRIBUTE BY asset")
                Tag_ZZDDF.createOrReplaceTempView("tag_ZZDDF")

                Tag_VVDDF = tsContext.sql("SELECT c.AssetSourceKey as asset, t.timestamp as timestamp, t.value as value_VV, t.quality as quality_VV FROM `timeseriesReadDF"
                                             + "` t JOIN `configDF` c on t.tag = c.MappingValue WHERE c.MappingKey = 'Tag_VV' DISTRIBUTE BY asset")
                Tag_VVDDF.createOrReplaceTempView("tag_VVDDF")

                Tag_XXYYDF =  tsContext.sql("SELECT COALESCE(tag_XXDDF.asset, tag_YYDDF.asset) as asset,COALESCE(tag_XXDDF.timestamp,tag_YYDDF.timestamp) as timestamp, tag_XXDDF.value_XX, tag_XXDDF.quality_XX, tag_YYDDF.quality_YY,tag_YYDDF.value_YY FROM tag_XXDDF FULL OUTER JOIN tag_YYDDF ON tag_XXDDF.asset = tag_YYDDF.asset and tag_XXDDF.timestamp = tag_YYDDF.timestamp DISTRIBUTE BY asset")
                Tag_ZZVVDF =  tsContext.sql("SELECT COALESCE(tag_ZZDDF.asset, tag_VVDDF.asset) as asset,COALESCE(tag_ZZDDF.timestamp,tag_VVDDF.timestamp) as timestamp,tag_ZZDDF.quality_ZZ, tag_ZZDDF.value_ZZ, tag_VVDDF.quality_VV,tag_VVDDF.value_VV FROM tag_ZZDDF FULL OUTER JOIN tag_VVDDF ON tag_ZZDDF.asset = tag_VVDDF.asset and tag_ZZDDF.timestamp = tag_VVDDF.timestamp DISTRIBUTE BY asset")
                Tag_XXYYDF.createOrReplaceTempView("tag_XXYYDF")
                Tag_ZZVVDF.createOrReplaceTempView("tag_ZZVVDF")
                timeseriesDF =  tsContext.sql("SELECT COALESCE(tag_XXYYDF.asset,tag_ZZVVDF.asset) as asset, COALESCE(tag_XXYYDF.timestamp,tag_ZZVVDF.timestamp) as timestamp, tag_XXYYDF.quality_XX, tag_XXYYDF.value_XX, tag_XXYYDF.quality_YY,tag_XXYYDF.value_YY, tag_ZZVVDF.quality_ZZ,tag_ZZVVDF.value_ZZ, tag_ZZVVDF.quality_VV,tag_ZZVVDF.value_VV FROM tag_XXYYDF FULL OUTER JOIN tag_ZZVVDF ON tag_XXYYDF.asset = tag_ZZVVDF.asset and tag_XXYYDF.timestamp = tag_ZZVVDF.timestamp")
                timeseriesDF.createOrReplaceTempView("collectedDS")

                queryString = "SELECT configDF.MappingValue as tag, "
                queryString +=  self.control_mode_query()
                queryString += " FROM `collectedDS` JOIN `configDF` on collectedDS.asset = configDF.assetSourceKey WHERE configDF.mappingType = 'OutputMappings'"
                resultDF = tsContext.sql(queryString)
                resultDF.createOrReplaceTempView("resultDF")
                timeseriesWriteDF = tsContext.sql("SELECT tag, timestamp, CAST((value) as double) as value, quality FROM `resultDF`")
                logger.info("Returning result...")
                result = {"timeseriesWriteDS" : timeseriesWriteDF}
                return result

            except Exception as e:
                print("ERROR RETURNED")
                logger.info("Error: " + str(e))
                exc_tb = sys.exc_info()[2]
                logger.info("Line number: " + str(exc_tb.tb_lineno))
    # ################ END ########################
Control Mode Constants
The script includes the following constants to represent the various control modes:
- MANUAL
- AUTO
- CASCADE
- SHUTDOWN
Available Tags
The following configurable tags can be queried in the script. These tags will be mapped to tags in Predix TimeSeries.
- Tag_VV
- Tag_XX
- Tag_YY
- Tag_ZZ
For these tags, the timestamp, quality, and value (T,Q,V) are represented in a table with the following columns:
| Timestamp | value_VV | quality_VV | value_XX | quality_XX | value_YY | quality_YY | value_ZZ | quality_ZZ |
Example Query
The script includes the following example query:
def control_mode_query(self):
        string = "timestamp as timestamp, CASE WHEN quality_XX != 3 OR quality_YY != 3 OR quality_ZZ != 3 OR quality_VV != 3 THEN " + self.SHUTDOWN
        string += " WHEN value_XX = 1 THEN "+self.MANUAL+" WHEN value_YY = 1 THEN "+self.AUTO+" WHEN value_ZZ = 1 THEN "+self.CASCADE+" WHEN value_VV = 1 THEN "+self.SHUTDOWN+" ELSE "+self.SHUTDOWN+" END as value," + self.QUALITY_GOOD +" as quality"
        return string
The preceding query does the following:
- Sets the control mode timestamp to the timestamp used by these tags.
- Sets the control mode quality to good.
- Sets the control mode value as follows:
- If the quality of any of the tags is bad, sets the control mode value to SHUTDOWN.
- Else if the value of tag_XX is 1, sets the control mode value to MANUAL.
- Else if the value of tag_YY is 1, sets the control mode value to AUTO.
- Else if the value of tag_ZZ is 1, sets the control mode value to CASCADE.
- Else, sets the control mode value to SHUTDOWN.
You should create your own query, based on your own business needs.
Modify the Control Mode Analytic
control_mode_query() function in the Python script, building up a SQL string to query one or more of the available tags and (based on the T,Q,V of these tags) to return a T,Q,V for the control mode.control_mode_query() function in this template. Do not modify anything else in the template.Create Your Analytic Template
Once you have modified the Python script to include the control mode logic you require, do the following.
Procedure
What To Do Next
Deploy CLPM Analytics
Deploy each of the CLPM analytics as described in this section.
Overview of CLPM Analytics
The following specialized analytics are provided with CLPM, and these are used for data collection and transformation.
| Analytic Name | Use | Location |
|---|---|---|
|
OPM-CLPM-Control_Mode |
Operates on scheduled data and contains the control mode logic. |
Will be in your Analytics Catalog if you have correctly performed the step to Set Up Control Mode Logic. |
|
OPM-CLPM-PV_Statistics |
Scheduled and produces the following KPIs based on the incoming data:
Consult the KPI Reference for details on the KPIs produced by this analytic. |
Located in your Analytics Catalog. If you do not find it there, contact your tenant administrator. |
|
OPM-CLPM-Performance |
Scheduled and produces a set of performance KPIs based on the incoming data. Consult the KPI Reference for details on the KPIs produced by this analytic. |
Located in your Analytics Catalog. If you do not find it there, contact your tenant administrator. |
|
OPM-CLPM-Performance_Ext |
Scheduled and produces a set of performance KPIs based on the incoming data. Consult the KPI Reference for details on the KPIs produced by this analytic. |
Located in your Analytics Catalog. If you do not find it there, contact your tenant administrator. |
|
OPM-CLPM-Config_Change |
Scheduled and produces the Total PIDF Changes KPI based on the incoming data. Consult the KPI Reference for details on this KPI. |
Located in your Analytics Catalog. If you do not find it there, contact your tenant administrator. |
|
OPM-CLPM-Alert_Perf |
Scheduled and produces an alert for poor overall performance. The Overall Performance KPI is compared to a threshold configured on the analytic. For the last 3 hourly calculated samples, if the Overall Performance KPI is greater than the threshold, an alert is triggered. Consult the KPI Reference for details on the Overall Performance KPI. |
Located in your Analytics Catalog. If you do not find it there, contact your tenant administrator. |
|
OPM-CLPM-Alert_Limits |
Scheduled and produces an alert for limits being exceeded. The Percentage Limits Exceeded KPI is compared to a threshold configured on the analytic. For the last 3 hourly calculated samples, if the Percentage Control On KPI is 100% and the Percentage Limits Exceeded KPI is greater than the threshold, an alert is triggered. Consult the KPI Reference for details on the Percentage Limits Exceeded KPI and Percentage Control On KPI. |
Located in your Analytics Catalog. If you do not find it there, contact your tenant administrator. |
|
OPM-CLPM-Alert_Manual |
Scheduled and produces an alert for control mode changing to Manual Mode. Control mode changes are examined over a data window of one hour. If the last control mode change detected is a change from Auto, Cascade, or Shutdown Mode to Manual Mode, an alert is triggered. For example, the following control modes recorded over the window have the following corresponding results. (Auto = A, Cascade = C, Shutdown = S, Manual = M)
|
Located in your Analytics Catalog. If you do not find it there, contact your tenant administrator. |
| OPM-CLPM-Alert_PV_Quality |
Scheduled and produces an alert for poor PV sensor data, indicating that a possible PV sensor health problem has been detected. This alert is triggered when the control mode is not Shutdown and either of the following is true:
Consult the KPI Reference for details on the PV Variance KPI. Recommendation: If running this analytic triggers an alert, check the PV sensor data collection and sensor health. |
Located in your Analytics Catalog. If you do not find it there, contact your tenant administrator. |
| OPM-CLPM-Alert_Tuning |
Scheduled and produces an alert indicating possible loop tuning or design problems. This alert is triggered when all of the following are true:
Consult the KPI Reference for details on each of the KPIs involved in triggering this alert. Recommendation: If running this analytic triggers an alert, review the loop tuning and design. |
Located in your Analytics Catalog. If you do not find it there, contact your tenant administrator. |
| OPM-CLPM-Alert_MV_Quality |
Scheduled and produces an alert for poor MV sensor data, indicating that a possible actuator health problem has been detected. This alert is triggered when the controller is on and any of the following is true:
Consult the KPI Reference for details on each of the KPIs involved in triggering this alert. Recommendation: If running this analytic triggers an alert, check the MV sensor data collection and actuator health. |
Located in your Analytics Catalog. If you do not find it there, contact your tenant administrator. |
Deploy analytics
Before You Begin
About This Task
This task describes how to deploy a single CLPM analytic.
Procedure
- Select the Add icon (
 ) next to Deployments to add a deployment.
CLPM Analytic Configuration
These tables give a configuration reference for the different types of CLPM analytics.
- OPM-CLPM-Control_Mode
- KPI analytics (share common configuration)
- OPM-CLPM-Performance
- OPM-CLPM-Performance_Ext
- OPM-CLPM-PV_Statistics
- KPI analytic: OPM-CLPM-Config_Change
- Alert analytic: OPM-CLPM-Alert_Perf
- Alert analytic: OPM-CLPM-Alert_Limits
- Alert analytic: OPM-CLPM-Alert_Manual
- Alert analytic: OPM-CLPM-Alert_PV_Quality
- Alert analytic: OPM-CLPM-Alert_Tuning
- Alert analytic: OPM-CLPM-Alert_MV_Quality
OPM-CLPM-Control_Mode Analytic
Configure the OPM-CLPM-Control_Mode analytic as described in the table that follows.
| Wizard Page | Option | Values | Comments |
|---|---|---|---|
| 1. Asset Selection: Select the target control loop assets for the analytic deployment. | Asset Filters | All Assets | Filter on All Assets. Use the search to select the target control loop assets for the analytic deployment. Note: All analytics are selected by default, so you will need to deselect all those you do not want and use the search to find the ones you do want. |
| 2. I/O Mapping: Map inputs and outputs in your analytic template definitions to tags on the control loop asset. | SELECTED STEP: OPM-CLPM-Control_Mode > Tag Mapping | Map for All Assets | |
| INPUT DEFINITION: TAGS & ATTRIBUTES | It is mandatory to map the Tag_VV input. The Tag_XX, Tag_YY, and Tag_ZZ inputs are optional. | Map the analytic inputs to tags on the selected control loop asset. These tags are used to determine control mode logic. | |
| OUTPUT DEFINITION: TAGS & ATTRIBUTES | It is mandatory to map the Control Mode output. This tag specifies the control mode logic. | Map the analytic outputs to tags on the selected control loop asset. Ensure that the analytic output name matches the corresponding mapped tag name exactly. | |
| 3. Schedule | SCHEDULE | Required value: Recurrent | |
| SCHEDULE > Repeats Every | Required value: 10 minutes | ||
| DATA REQUEST > Offset Before Schedule | Required value: 10 minutes | ||
| DATA REQUEST > Sample Duration | Required value: 10 minutes | ||
| DATA REQUEST > Sample Data | Required value: Interpolated | ||
| DATA REQUEST > Sampling Interval | Required value: 1 second | ||
| 4. Review | Review the deployment to ensure that all configuration is correct. |
KPI Analytics
Configure the following KPI analytics as described in the table that follows.
- OPM-CLPM-Performance
- OPM-CLPM-Performance_Ext
- OPM-CLPM-PV_Statistics
| Wizard Page | Option | Values | Comments |
|---|---|---|---|
| 1. Asset Selection: Select the target control loop assets for the analytic deployment. | Asset Filters | All Assets | Filter on All Assets. Use the search to select the target control loop assets for the analytic deployment. Note: All analytics are selected by default, so you will need to deselect all those you do not want and use the search to find the ones you do want. |
| 2. I/O Mapping: Map inputs and outputs in your analytic template definitions to tags on the control loop asset. | SELECTED STEP: <analytic_name> > Tag Mapping | Map for All Assets | |
| INPUT DEFINITION: TAGS & ATTRIBUTES | Map the analytic inputs to tags on the selected control loop asset. Ensure that each analytic input name matches the corresponding mapped tag name exactly. | ||
| OUTPUT DEFINITION: TAGS & ATTRIBUTES | Map the analytic outputs to tags on the selected control loop asset. Ensure that the analytic output name matches the corresponding mapped tag name exactly. | ||
| 3. Schedule | SCHEDULE | Required value: Recurrent | |
| SCHEDULE > Repeats Every | Required value: 60 minutes | ||
| DATA REQUEST > Offset Before Schedule | Required value: 60 minutes | ||
| DATA REQUEST > Sample Duration | Required value: 60 minutes | ||
| DATA REQUEST > Sample Data | Required value: Interpolated | ||
| DATA REQUEST > Sampling Interval | Required value: 1 second | ||
| 4. Review | Review the deployment to ensure that all configuration is correct. |
OPM-CLPM-Config_Change Analytic
Configure the OPM-CLPM-Config_Change analytic as described in the table that follows.
| Wizard Page | Option | Values | Comments |
|---|---|---|---|
| 1. Asset Selection: Select the target control loop assets for the analytic deployment. | Asset Filters | All Assets | Filter on All Assets. Use the search to select the target control loop assets for the analytic deployment. Note: All analytics are selected by default, so you will need to deselect all those you do not want and use the search to find the ones you do want. |
| 2. I/O Mapping: Map inputs and outputs in your analytic template definitions to tags on the control loop asset. | SELECTED STEP: OPM-CLPM-Config_Change > Tag Mapping | Map for All Assets | |
| INPUT DEFINITION: TAGS & ATTRIBUTES | Not all the P, I, D, and F inputs need to be mapped, as these inputs are optional. However, some will have to be mapped. | Map the analytic inputs to tags on the selected control loop asset. Ensure that each analytic input name matches the corresponding mapped tag name exactly. | |
| OUTPUT DEFINITION: TAGS & ATTRIBUTES | Map the analytic outputs to tags on the selected control loop asset. Ensure that the analytic output name matches the corresponding mapped tag name exactly. | ||
| 3. Schedule | SCHEDULE | Required value: Recurrent | |
| SCHEDULE > Repeats Every | Required value: 60 minutes | ||
| DATA REQUEST > Offset Before Schedule | Required value: 60 minutes | ||
| DATA REQUEST > Sample Duration | Required value: 60 minutes | ||
| DATA REQUEST > Sample Data | Required value: Interpolated | ||
| DATA REQUEST > Sampling Interval | Required value: 1 second | ||
| 4. Review | Review the deployment to ensure that all configuration is correct. |
OPM-CLPM-Alert_Perf Analytic
Configure the OPM-CLPM-Alert_Perf analytic as described in the table that follows.
| Wizard Page | Option | Values | Comments |
|---|---|---|---|
| 1. Asset Selection: Select the target control loop assets for the analytic deployment. | Asset Filters | All Assets | Filter on All Assets. Use the search to select the target control loop assets for the analytic deployment. Note: All assets are selected by default, so you will need to deselect all those you do not want and use the search to find the ones you do want. |
| 2. I/O Mapping: Map inputs and outputs in your analytic template definitions to tags on the control loop asset. | SELECTED STEP: OPM-CLPM-Alert_Perf > Tag Mapping | Map for All Assets | |
| INPUT DEFINITION: TAGS & ATTRIBUTES | Required input tag: Overall Performance, Type: Double. | Map the analytic input to the tag on the selected control loop asset. Ensure that the analytic input name matches the corresponding mapped tag name exactly. The Overall Performance tag is a KPI tag produced by a previously run CLPM analytic. | |
| CONSTANTS: | Name: Threshold, Type: Double, Value: <a value between 0 and 100>, Data Format: Constant | Define a threshold constant for the analytic. The Overall Performance KPI is compared to this threshold maximum value. For the last 3 hourly calculated samples, if the Overall Performance KPI is greater than the threshold, an alert is triggered. Consult the KPI Reference for details on the Overall Performance KPI. | |
| [Prepopulated Constant] Name: alertTemplateName, Value: CLPM-Loop_Performance, Type: String, Data Format: Constant |
Note: This constant is already defined on the analytic. Do not modify this constant.
| ||
| OUTPUT DEFINITION: ALERTS | [Prepopulated Alert] Name: CLPM-Loop_Performance, Active: On |
Note: This alert mapping is already defined on the analytic. Do not modify this alert mapping.
| |
| 3. Schedule | SCHEDULE | Required value: Recurrent | |
| SCHEDULE > Repeats Every | Required value: 60 minutes | ||
| DATA REQUEST > Offset Before Schedule | Required value: 60 minutes | ||
| DATA REQUEST > Sample Duration | Required value: 180 minutes | ||
| DATA REQUEST > Sample Data | Required value: Interpolated | ||
| DATA REQUEST > Sampling Interval | Required value: 1 hour | ||
| 4. Review | Review the deployment to ensure that all configuration is correct. |
OPM-CLPM-Alert_Limits Analytic
Configure the OPM-CLPM-Alert_Limits analytic as described in the table that follows.
| Wizard Page | Option | Values | Comments |
|---|---|---|---|
| 1. Asset Selection: Select the target control loop assets for the analytic deployment. | Asset Filters | All Assets | Filter on All Assets. Use the search to select the target control loop assets for the analytic deployment. Note: All assets are selected by default, so you will need to deselect all those you do not want and use the search to find the ones you do want. |
| 2. I/O Mapping: Map inputs and outputs in your analytic template definitions to tags on the control loop asset. | SELECTED STEP: OPM-CLPM-Alert_Limits > Tag Mapping | Map for All Assets | |
| INPUT DEFINITION: TAGS & ATTRIBUTES | Required input tag: Percentage Limits Exceeded, Type: Double. | Map the analytic input to the tag on the selected control loop asset. Ensure that the analytic input name matches the corresponding mapped tag name exactly. The Percentage Limits Exceeded tag is a KPI tag produced by a previously run CLPM analytic. | |
| Required input tag: Percentage Control On, Type: Double. | Map the analytic input to the tag on the selected control loop asset. Ensure that the analytic input name matches the corresponding mapped tag name exactly. The Percentage Control On tag is a KPI tag produced by a previously run CLPM analytic. | ||
| CONSTANTS: | Name: Threshold, Type: Double, Value: <a value between 0 and 100>, Data Format: Constant | Define a threshold constant for the analytic. The Percentage Limits Exceeded KPI is compared to this threshold maximum value. For the last 3 hourly calculated samples, if the Percentage Control On KPI is 100% and the Percentage Limits Exceeded KPI is greater than this threshold, an alert is triggered. Consult the KPI Reference for details on the Percentage Limits Exceeded KPI. | |
| [Prepopulated Constant] Name: alertTemplateName, Value: CLPM-Limits_Exceeded, Type: String, Data Format: Constant |
Note: This constant is already defined on the analytic. Do not modify this constant.
| ||
| OUTPUT DEFINITION: ALERTS | [Prepopulated Alert] Name: CLPM-Limits_Exceeded, Active: On |
Note: This alert mapping is already defined on the analytic. Do not modify this alert mapping.
| |
| 3. Schedule | SCHEDULE | Required value: Recurrent | |
| SCHEDULE > Repeats Every | Required value: 60 minutes | ||
| DATA REQUEST > Offset Before Schedule | Required value: 60 minutes | ||
| DATA REQUEST > Sample Duration | Required value: 180 minutes | ||
| DATA REQUEST > Sample Data | Required value: Interpolated | ||
| DATA REQUEST > Sampling Interval | Required value: 1 hour | ||
| 4. Review | Review the deployment to ensure that all configuration is correct. |
OPM-CLPM-Alert_Manual Analytic
Configure the OPM-CLPM-Alert_Manual analytic as described in the table that follows.
| Wizard Page | Option | Values | Comments |
|---|---|---|---|
| 1. Asset Selection: Select the target control loop assets for the analytic deployment. | Asset Filters | All Assets | Filter on All Assets. Use the search to select the target control loop assets for the analytic deployment. Note: All assets are selected by default, so you will need to deselect all those you do not want and use the search to find the ones you do want. |
| 2. I/O Mapping: Map inputs and outputs in your analytic template definitions to tags on the control loop asset. | SELECTED STEP: OPM-CLPM-Alert_Manual > Tag Mapping | Map for All Assets | |
| INPUT DEFINITION: TAGS & ATTRIBUTES | Required input tag: Control Mode, Type: Double. | Map the analytic input to the tag on the selected control loop asset. Ensure that the analytic input name matches the corresponding mapped tag name exactly. | |
| CONSTANTS: | [Prepopulated Constant] Name: alertTemplateName, Value: CLPM-Manual_Control, Type: String, Data Format: Constant |
Note: This constant is already defined on the analytic. Do not modify this constant.
| |
| OUTPUT DEFINITION: ALERTS | [Prepopulated Alert] Name: CLPM-Manual_Control, Active: On |
Note: This alert mapping is already defined on the analytic. Do not modify this alert mapping.
| |
| 3. Schedule | SCHEDULE | Required value: Recurrent | |
| SCHEDULE > Repeats Every | Required value: 60 minutes | ||
| DATA REQUEST > Offset Before Schedule | Required value: 60 minutes | ||
| DATA REQUEST > Sample Duration | Any window size acceptable. Recommended value: 60 minutes | ||
| DATA REQUEST > Sample Data | Required value: Interpolated | ||
| DATA REQUEST > Sampling Interval | Recommended value: 1 second or the rate at which control mode values are written to Predix Timeseries | ||
| 4. Review | Review the deployment to ensure that all configuration is correct. |
OPM-CLPM-Alert_PV_Quality Analytic
Configure the OPM-CLPM-Alert_PV_Quality analytic as described in the table that follows.
| Wizard Page | Option | Values | Comments |
|---|---|---|---|
| 1. Asset Selection: Select the target control loop assets for the analytic deployment. | Asset Filters | All Assets | Filter on All Assets. Use the search to select the target control loop assets for the analytic deployment. Note: All assets are selected by default, so you will need to deselect all those you do not want and use the search to find the ones you do want. |
| 2. I/O Mapping: Map inputs and outputs in your analytic template definitions to tags on the control loop asset. | SELECTED STEP: OPM-CLPM-Alert_PV_Quality > Tag Mapping | Map for All Assets | |
| INPUT DEFINITION: TAGS & ATTRIBUTES | Required input tag: PV, Type: Double | Map the analytic input to the tag on the selected control loop asset. Ensure that the analytic input name matches the corresponding mapped tag name exactly. This tag is needed to calculate percentage good quality. For the calculated samples over the last data window, the percentage of PV values that are of good quality is compared to the PV_Quality_Threshold constant you will configure on this page. | |
| Required input tag: PV Variance, Type: Double | Map the analytic input to the tag on the selected control loop asset. Ensure that the analytic input name matches the corresponding mapped tag name exactly. The PV Variance tag is a KPI tag produced by a previously run CLPM analytic. If the PV Variance KPI is zero (i.e., the PV is flatlining) for the calculated samples over the last data window, and the control mode is not Shutdown, an alert is triggered. | ||
| CONSTANTS: | Required input tag: Control Mode, Type: Double | Map the analytic input to the tag on the selected control loop asset. Ensure that the analytic input name matches the corresponding mapped tag name exactly. | |
| Name: PV_Quality_Threshold, Type: Double, Value: <a value between 0 and 100>, Data Format: Constant | Define a threshold percentage constant for the analytic. For the calculated samples over the last data window, the percentage of PV values that are of good quality is compared to this threshold percentage. If that quality is lower than the threshold, and the control mode is not Shutdown, an alert is triggered. | ||
| [Prepopulated Constant] Name: alertTemplateName, Value: CLPM-Sensor_Health, Type: String, Data Format: Constant |
Note: This constant is already defined on the analytic. Do not modify this constant.
| ||
| OUTPUT DEFINITION: ALERTS | [Prepopulated Alert] Name: CLPM-Sensor_Health, Active: On |
Note: This alert mapping is already defined on the analytic. Do not modify this alert mapping.
| |
| 3. Schedule | SCHEDULE | Required value: Recurrent | |
| SCHEDULE > Repeats Every | Required value: 60 minutes | ||
| DATA REQUEST > Offset Before Schedule | Required value: 60 minutes | ||
| DATA REQUEST > Sample Duration | Minimum value: 60 minutes, Recommended value: 60 minutes | ||
| DATA REQUEST > Sample Data | Required value: Interpolated | ||
| DATA REQUEST > Sampling Interval | Recommended value: 1 second or the rate at which control mode and PV values are written to Predix Timeseries | ||
| 4. Review | Review the deployment to ensure that all configuration is correct. |
OPM-CLPM-Alert_Tuning Analytic
Configure the OPM-CLPM-Alert_Tuning analytic as described in the table that follows.
| Wizard Page | Option | Values | Comments |
|---|---|---|---|
| 1. Asset Selection: Select the target control loop assets for the analytic deployment. | Asset Filters | All Assets | Filter on All Assets. Use the search to select the target control loop assets for the analytic deployment. Note: All assets are selected by default, so you will need to deselect all those you do not want and use the search to find the ones you do want. |
| 2. I/O Mapping: Map inputs and outputs in your analytic template definitions to tags on the control loop asset. | SELECTED STEP: OPM-CLPM-Alert_Tuning > Tag Mapping | Map for All Assets | |
| INPUT DEFINITION: TAGS & ATTRIBUTES | Required input tag: Reversal Count, Type: Double. | Map the analytic input to the tag on the selected control loop asset. Ensure that the analytic input name matches the corresponding mapped tag name exactly. The Reversal Count tag is a KPI tag produced by a previously run CLPM analytic. This KPI is compared to the Reversal_Count_Threshold constant you will configure on this page. | |
| Required input tag: Reversal Amplitude, Type: Double. | Map the analytic input to the tag on the selected control loop asset. Ensure that the analytic input name matches the corresponding mapped tag name exactly. The Reversal Amplitude tag is a KPI tag produced by a previously run CLPM analytic. This KPI is compared to the Reversal_Amplitude_Threshold constant you will configure on this page. | ||
| Required input tag: Percentage MV Saturation, Type: Double. | Map the analytic input to the tag on the selected control loop asset. Ensure that the analytic input name matches the corresponding mapped tag name exactly. The Percentage MV Saturation tag is a KPI tag produced by a previously run CLPM analytic. This KPI is compared to the Percentage_MV_Saturation_Threshold constant you will configure on this page. | ||
| Required input tag: Percentage Control On, Type: Double, Value: <a value between 0 and 100> | Map the analytic input to the tag on the selected control loop asset. Ensure that the analytic input name matches the corresponding mapped tag name exactly. The Percentage Control On tag is a KPI tag produced by a previously run CLPM analytic. If the Percentage Control On KPI is 100%, this satisfies one of the requirements for an alert to be triggered. | ||
| Required input tag: Percentage Limits Exceeded, Type: Double. | Map the analytic input to the tag on the selected control loop asset. Ensure that the analytic input name matches the corresponding mapped tag name exactly. The Percentage Limits Exceeded tag is a KPI tag produced by a previously run CLPM analytic. This KPI is compared to the Percentage_Limits_Exceeded_Threshold constant you will configure on this page. | ||
| CONSTANTS: | Name: Reversal_Count_Threshold, Type: Double, Value: <any whole number>, Data Format: Constant | Define a reversal count threshold constant for the analytic. For the calculated samples over the last data window, the Reversal Count KPI is compared to this threshold. If the KPI is greater than the threshold, this satisfies one of the requirements for an alert to be triggered. | |
| Name: Reversal_Amplitude_Threshold, Type: Double, Value: <any whole number>, Data Format: Constant | Define a reversal amplitude threshold constant for the analytic. For the calculated samples over the last data window, the Reversal Amplitude KPI is compared to this threshold. If the KPI is greater than the threshold, this satisfies one of the requirements for an alert to be triggered. | ||
| Name: Percentage_MV_Saturation_Threshold, Type: Double, Value: <any whole number>, Data Format: Constant | Define a percentage MV saturation threshold constant for the analytic. For the calculated samples over the last data window, the Percentage MV Saturation KPI is compared to this threshold. If the KPI is less than the threshold, this satisfies one of the requirements for an alert to be triggered. | ||
| Name: Percentage_Limits_Exceeded_Threshold, Type: Double, Value: <any whole number>, Data Format: Constant | Define a percentage limits exceeded threshold constant for the analytic. For the calculated samples over the last data window, the Percentage Limits Exceeded KPI is compared to this threshold. If the KPI is greater than the threshold, this satisfies one of the requirements for an alert to be triggered. | ||
| [Prepopulated Constant] Name: alertTemplateName, Value: CLPM-Loop_TuningOrDesign, Type: String, Data Format: Constant |
Note: This constant is already defined on the analytic. Do not modify this constant.
| ||
| OUTPUT DEFINITION: ALERTS | [Prepopulated Alert] Name: CLPM-Loop_TuningOrDesign, Active: On |
Note: This alert mapping is already defined on the analytic. Do not modify this alert mapping.
| |
| 3. Schedule | SCHEDULE | Required value: Recurrent | |
| SCHEDULE > Repeats Every | Required value: 60 minutes | ||
| DATA REQUEST > Offset Before Schedule | Required value: 60 minutes | ||
| DATA REQUEST > Sample Duration | Minimum value: 60 minutes, Recommended value: 60 minutes | ||
| DATA REQUEST > Sample Data | Required value: Interpolated | ||
| DATA REQUEST > Sampling Interval | Required value: 1 hour | ||
| 4. Review | Review the deployment to ensure that all configuration is correct. |
OPM-CLPM-Alert_MV_Quality Analytic
Configure the OPM-CLPM-Alert_MV_Quality analytic as described in the table that follows.
| Wizard Page | Option | Values | Comments |
|---|---|---|---|
| 1. Asset Selection: Select the target control loop assets for the analytic deployment. | Asset Filters | All Assets | Filter on All Assets. Use the search to select the target control loop assets for the analytic deployment. Note: All assets are selected by default, so you will need to deselect all those you do not want and use the search to find the ones you do want. |
| 2. I/O Mapping: Map inputs and outputs in your analytic template definitions to tags on the control loop asset. | SELECTED STEP: OPM-CLPM-Alert_MV_Quality > Tag Mapping | Map for All Assets | |
| INPUT DEFINITION: TAGS & ATTRIBUTES | Required input tag: MV, Type: Double | Map the analytic input to the tag on the selected control loop asset. Ensure that the analytic input name matches the corresponding mapped tag name exactly. This tag is needed to calculate percentage good quality. For the calculated samples over the last data window, the percentage of MV values that are of good quality is compared to the MV_Quality_Threshold constant you will configure on this page. | |
| Required input tag: Movement Index, Type: Double | Map the analytic input to the tag on the selected control loop asset. Ensure that the analytic input name matches the corresponding mapped tag name exactly. The Movement Index tag is a KPI tag produced by a previously run CLPM analytic. If the Movement Index KPI is zero (i.e., the MV is flatlining) for the calculated samples over the last data window, this satisfies one of the requirements for an alert to be triggered. | ||
| Required input tag: Percentage MV Saturation, Type: Double, Value: <a value between 0 and 100> | Map the analytic input to the tag on the selected control loop asset. Ensure that the analytic input name matches the corresponding mapped tag name exactly. The Percentage MV Saturation is a KPI tag produced by a previously run CLPM analytic. For the calculated samples over the last data window, the Percentage MV Saturation KPI is compared to the Percentage_MV_Saturation_Threshold constant you will configure on this page. | ||
| Required input tag: Percentage Control On, Type: Double, Value: <a value between 0 and 100> | Map the analytic input to the tag on the selected control loop asset. Ensure that the analytic input name matches the corresponding mapped tag name exactly. The Percentage Control On tag is a KPI tag produced by a previously run CLPM analytic. If the Percentage Control On KPI is 100%, this satisfies one of the requirements for an alert to be triggered. | ||
| CONSTANTS: | Name: MV_Quality_Threshold, Type: Double, Value: <a value between 0 and 100>, Data Format: Constant | Define a threshold percentage constant for the analytic. For the calculated samples over the last data window, the percentage of MV values that are of good quality is compared to this threshold percentage. If that quality is lower than the threshold, this satisfies one of the requirements for an alert to be triggered. | |
| Name: Percentage_MV_Saturation_Threshold, Type: Double, Value: <a value between 0 and 100>, Data Format: Constant | Define a percentage MV saturation threshold constant for the analytic. For the calculated samples over the last data window, the Percentage MV Saturation KPI is compared to this threshold. If the KPI is less than the threshold, this satisfies one of the requirements for an alert to be triggered. | ||
| [Prepopulated Constant] Name: alertTemplateName, Value: CLPM-Actuator_Health, Type: String, Data Format: Constant |
Note: This constant is already defined on the analytic. Do not modify this constant.
| ||
| OUTPUT DEFINITION: ALERTS | [Prepopulated Alert] Name: CLPM-Actuator_Health, Active: On |
Note: This alert mapping is already defined on the analytic. Do not modify this alert mapping.
| |
| 3. Schedule | SCHEDULE | Required value: Recurrent | |
| SCHEDULE > Repeats Every | Required value: 60 minutes | ||
| DATA REQUEST > Offset Before Schedule | Required value: 60 minutes | ||
| DATA REQUEST > Sample Duration | Minimum value: 60 minutes, Recommended value: 60 minutes | ||
| DATA REQUEST > Sample Data | Required value: Interpolated | ||
| DATA REQUEST > Sampling Interval | Recommended value: 1 second or the rate at which MV values are written to Predix Timeseries | ||
| 4. Review | Review the deployment to ensure that all configuration is correct. |