Troubleshooter
About Troubleshooter
A process engineer may observe some deviations in the process having impact on key indicators. To troubleshoot or analyze the root cause, the high contributing factors must be identified through variable importance and correlation to optimize the rectification of the process to bring the normalcy quickly.
Most of the process engineers are often overwhelmed by the amount of data available to them. Until recently, most industries collected only a small amount of information on their processes. Process engineers had a few observations on fewer critical variables that helped them decide on how the process had to be operated.
In the data-driven world, to overcome the human limitation on comprehending huge data set and interrelationship between various key parameters, OPM Troubleshooter helps in creating a correlations map for the given target variable by using a variable importance ranking to identify the critical impacting variable.
Discovering Correlation
Using the OPM Troubleshooter, you can examine data (that is, sensor data, calculated tags, attributes) to analyze the impact of ranked variable and correlation across variables with respect to the selected target variable or KPI.
Before You Begin
Ensure that the OPM Troubleshooter is enabled for the tenant, and the required permission set is assigned.
Procedure
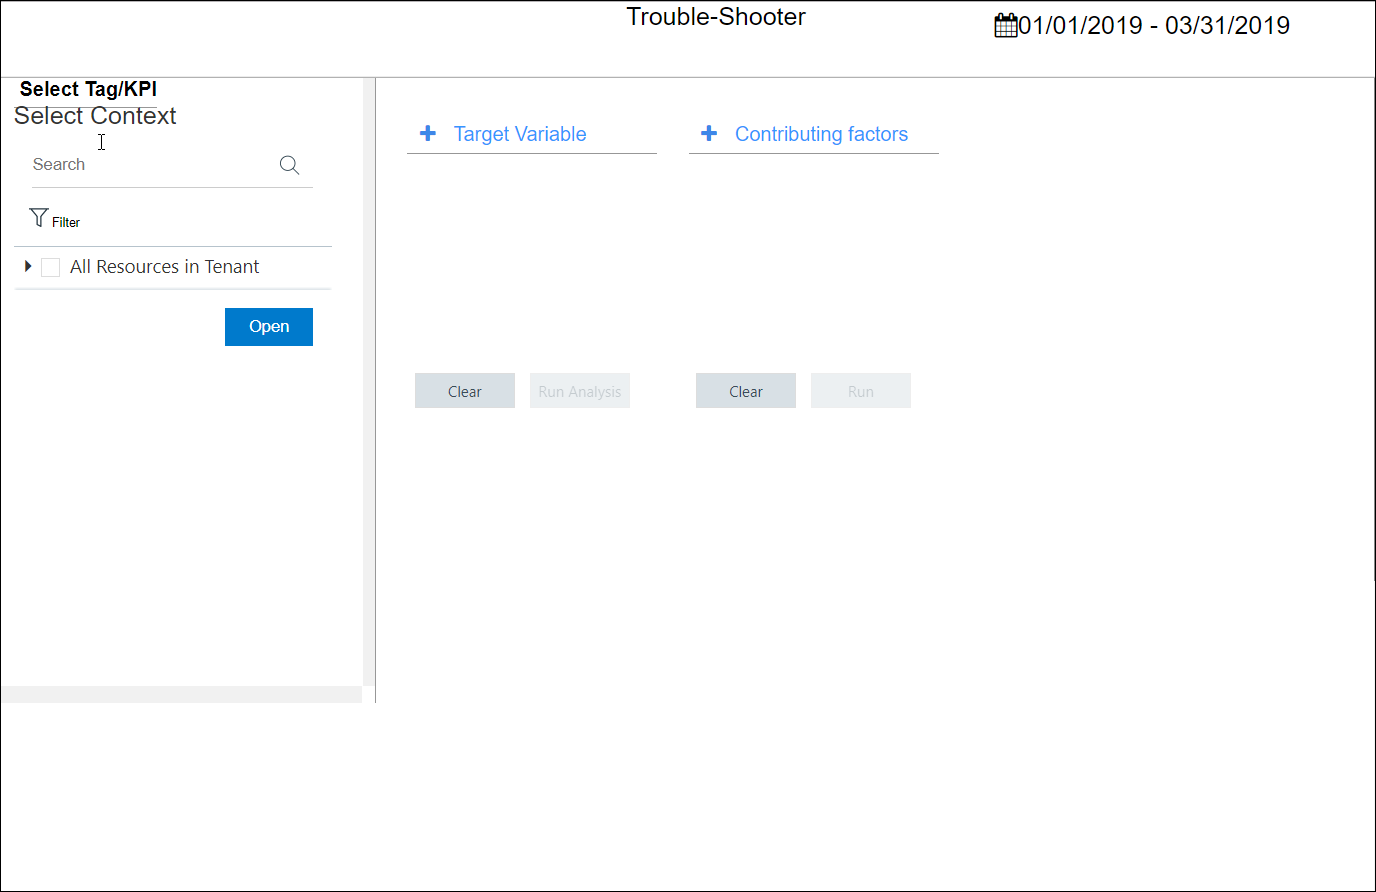
- In the module navigation menu, select Troubleshooter.The Trouble-Shooter page appears.
- Select the tag, and then in the Target Variable section, select
 .Note: You can add only one tag at a time to the Target Variable section.The selected tag is added to the Target Variable section, and the Run Analysis button is enabled.
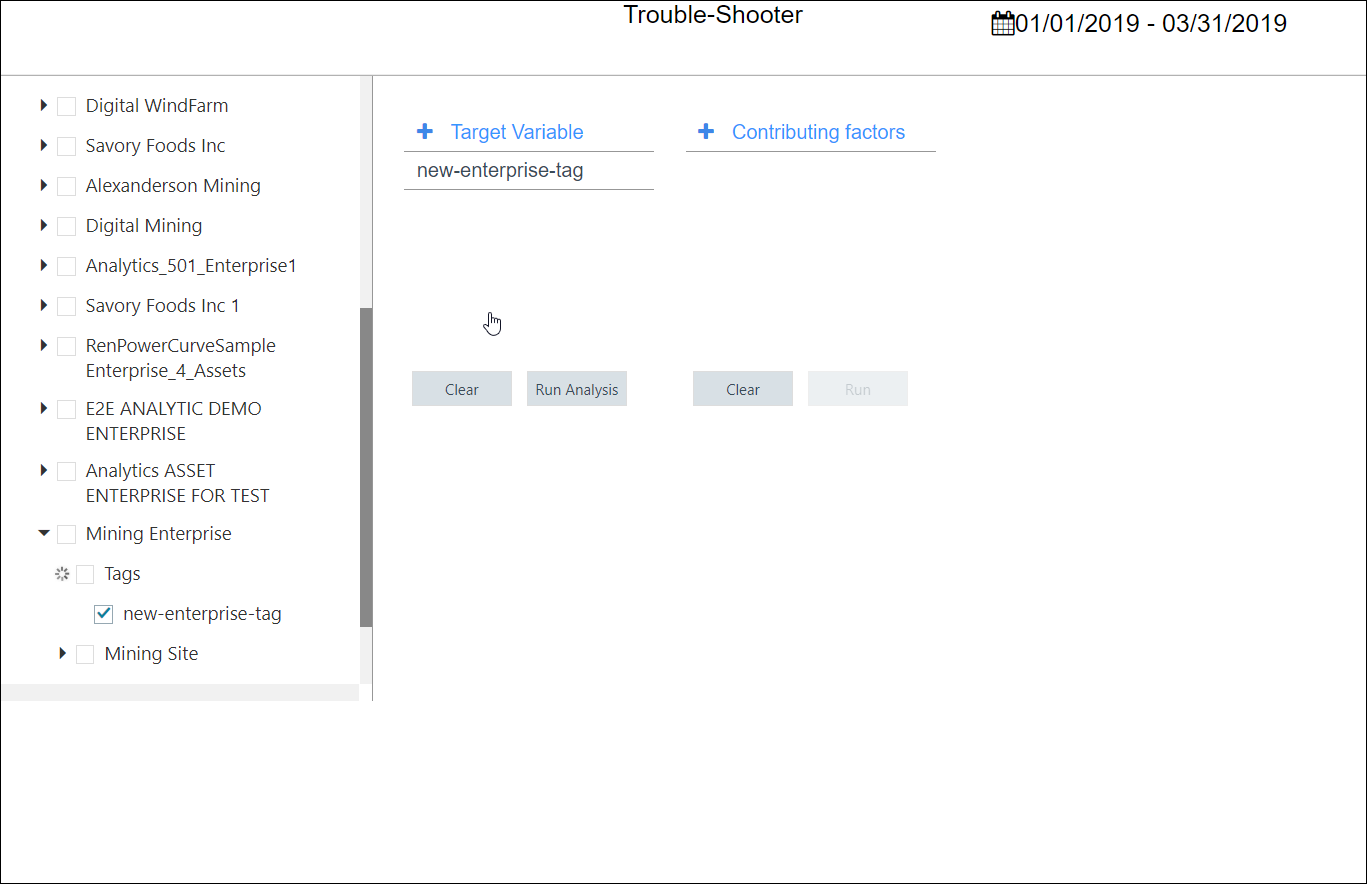
- Select Run Analysis.A call is triggered to the OPM service, which will run a variable importance analysis. The five main contributing factors appear in the Contributing factors section, and the Run button is enabled.Note: The contributing factors are listed in the descending order starting with the most contributing factor first.
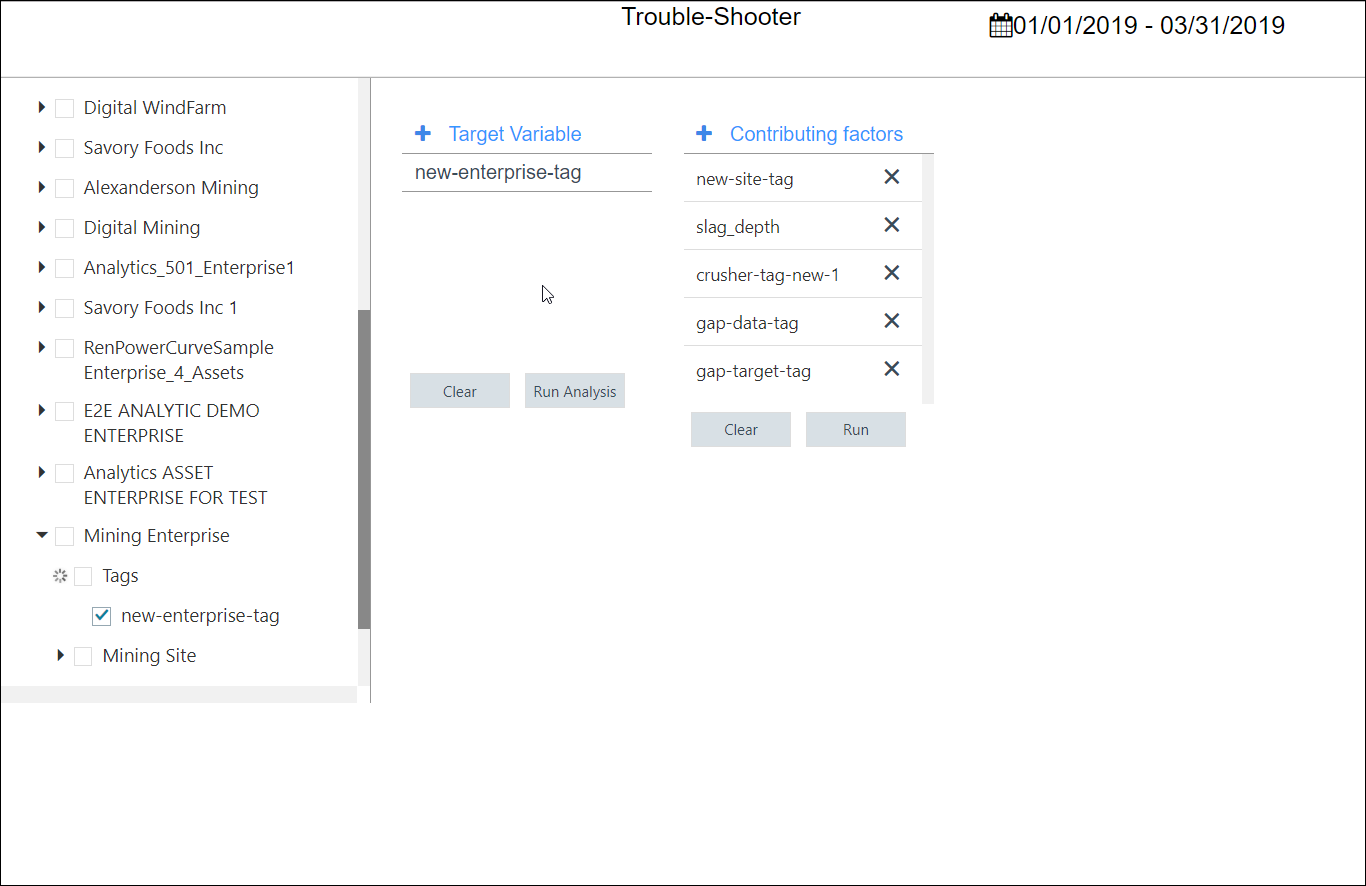
Also, you can add tags as contributing factors by selecting
in the Contributing factors section. To delete a contributing factor, select
 .
. - Select Run.A bar graph appears based on the analysis.
The name of the contributing factor consists of a number that specifies the lag value that contributes to the correlation analysis. On the graph, the blue color indicates that the correlation is greater than zero, and the red color indicates that the correlation is less than zero.