OPM Forecasting Widget
About the OPM Forecasting Widget
Forecasting is essential for organizations to implement their operation management strategies. Forecasting is used to determine possible future outcomes for the business. Accurate forecasting plays an essential role in the operation and management of plants and sites, as it provides relevant and dependable information about past and present events, as well as probable future events
The primary advantage of forecasting is that it provides organizations with important information that they can use to make decisions about the future of the organization. Forecasting can be used as a vital tool in modern operations, as it enables you to visualize future trends and provides a clear picture of the environment in which you may operate. You can use accurate forecasting to minimize risk that arises because of guesswork.
The OPM Forecasting Widget uses historical data as inputs to make informed estimates that are predictive in determining the direction of future trends. Using the historical time-series data of assets, the widget creates a graphical forecast of the predicted future values of Key Performance Indicators (KPIs) and sensor values. You can use the widget as a decision-making tool to help in budgeting, planning, and estimating future events.
About Confidence Bands
A confidence band in a forecast is the range surrounding each predicted value in which the future forecast points are expected to fall. A confidence band on a forecast graph consists of two lines that depict the upper and lower confidence bounds for all points on a fitted line within the range of data. A confidence band indicates the variance or the deviation of the prediction.
Confidence bands help you determine the accuracy of predictions. A narrower band indicates more confidence in the prediction for the specific point.
Configure the OPM Forecasting Widget
Configure the OPM Forecasting widget to plot forecast data using historical data.
About This Task
Procedure
- Select
 , and then select Add New Card.
 - In the card, select
 , and then select Edit Card.The Add Widget button appears.
 - In the widget, select , then select Edit Card, and then select
 .The Configure Widget page appears, displaying a blank forecast chart workspace and the different options for configuring the widget.
 - Drag tags from Select Tag/Kpi section to the chart workspace to create a forecast.A forecast for the tags is plotted using the historical data.Tip:
- Expand the tag hierarchy before performing the initial search.
- You can search for tags using the Search box or you can use the hierarchy of Tags in the Select Tag/Kpi section. The first search is limited to the expanded tree view, that is, the search performed for the visible tags.
- You can plot a maximum of three tags for your forecast.
- The used tags cannot be plotted again.
Important:- A minimum of 30 days of data from the previous 90 days, at hourly resolution, is required to forecast.
Note: To delete a tag from the forecast, select , and then select Delete.
 - Set the historical data to be displayed in the forecast by selecting one of the options the workspace. You can select from the following intervals:
- 15 days
- 30 days
- 60 days
- 90 days
The forecast chart is updated with the historical data and the confidence band.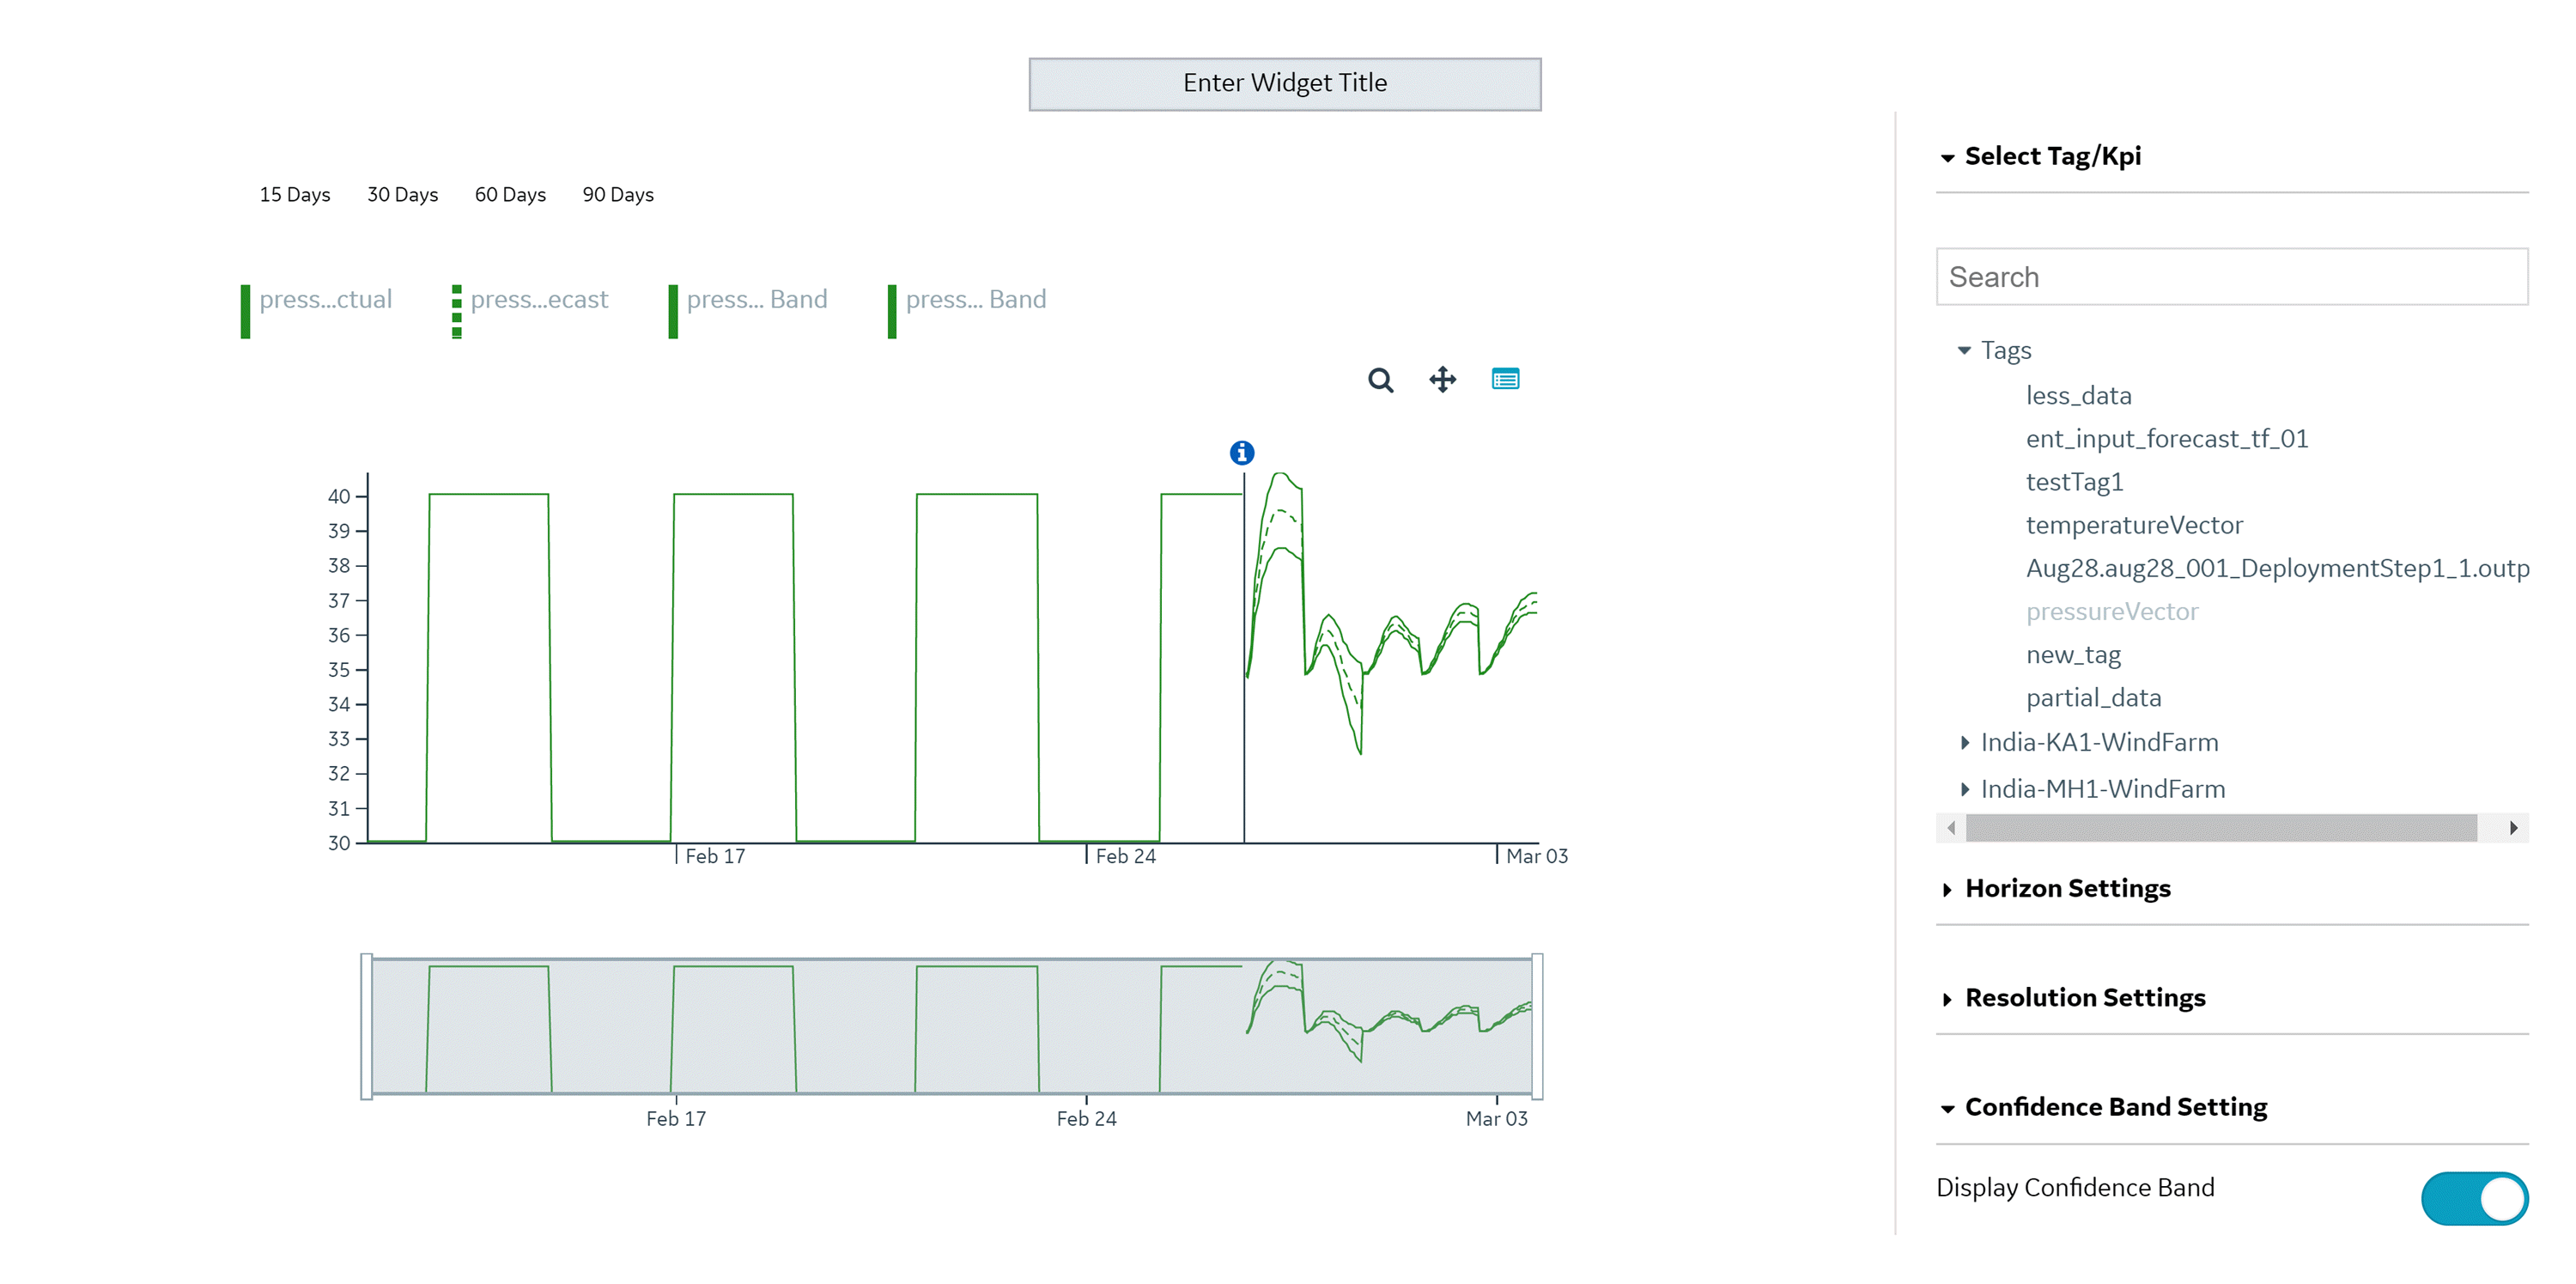 Tip: If the forecast is plotted without historical data, select a larger historical data interval.Note: Below the forecast chart, a chart navigator appears, using which you can track and analyze the forecast chart.
Access the OPM Forecasting Widget
After the Forecasting widget has been configured, you can use the widget to analyze forecast data.
Procedure
- Select the dashboard where the Forecasting widget has been configured and added.Note: You can add this dashboard to your favorites by selecting
 . Recently opened dashboards are available in the Recently Opened section.
 - Set the historical data to be displayed in the forecast by selecting one of the options in the workspace. You can select from the following intervals:
- 15 days
- 30 days
- 60 days
- 90 days
The forecast chart is updated with the historical data and the confidence band. You can change the configuration settings of the widget using the different options.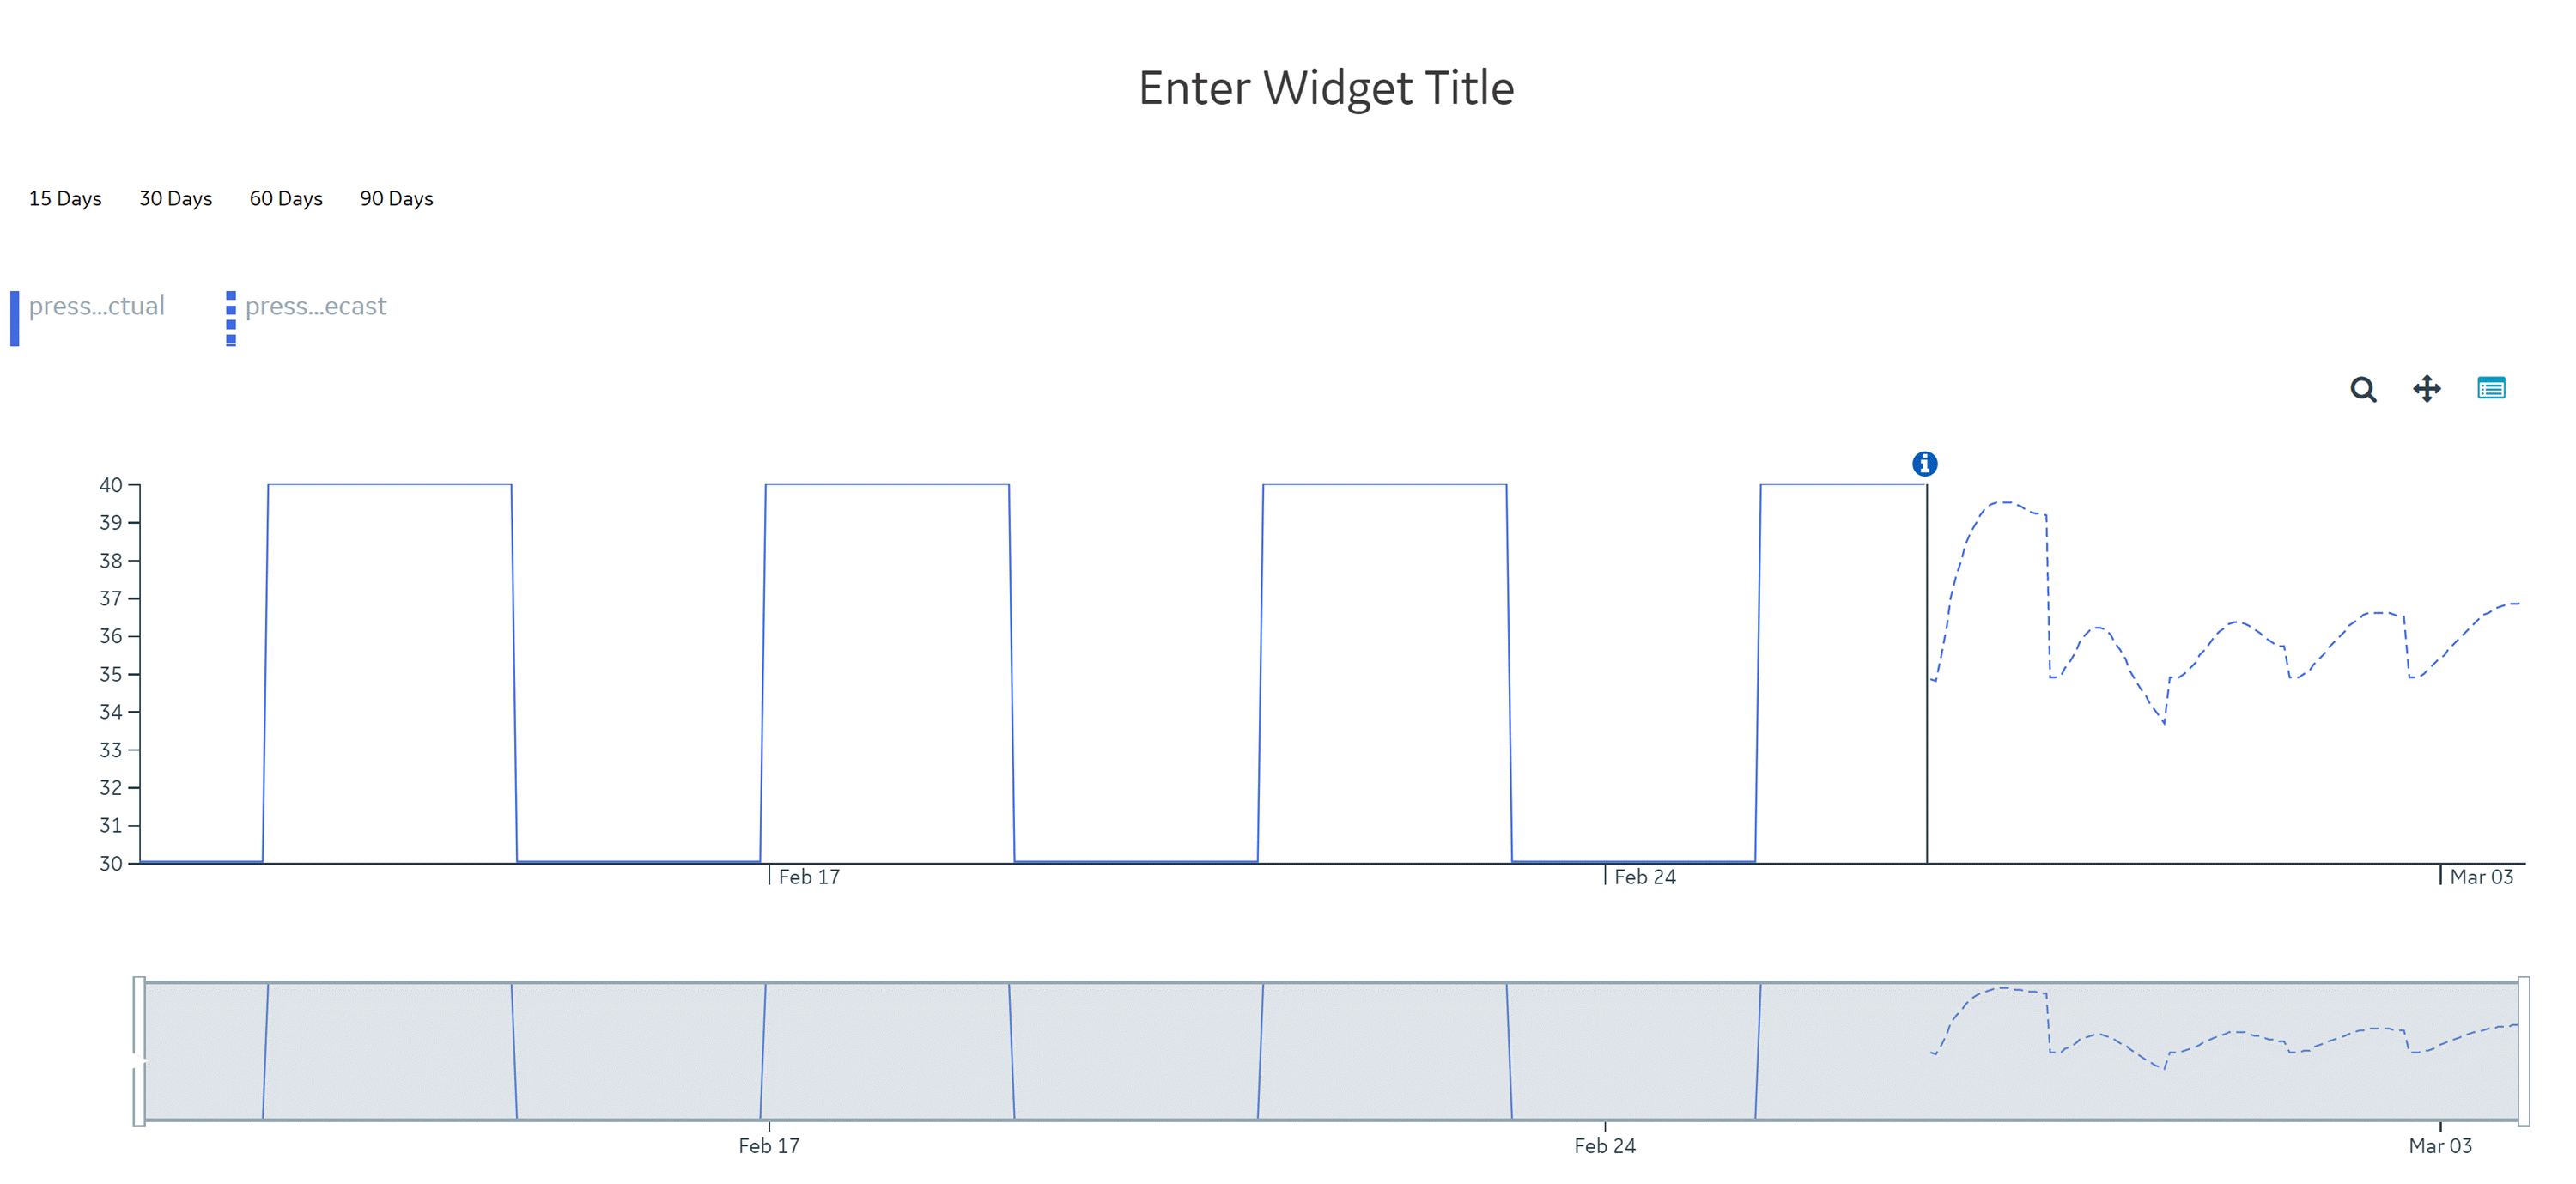 Note: Below the forecast chart, a chart navigator appears, using which you can track and analyze the forecast chart.Tip: The changes you make while viewing the forecast are not saved. When you access the widget the next time, it will open with the last saved configuration settings.