Historian
Access a System
Procedure
- Access Configuration Hub.
-
In the NAVIGATION section, under the Configuration Hub
plugin for Historian, expand Systems, and then select the
system that you want to access.
The system appears in the main section. The following details of the system appear in the DETAILS section.
Table 1. The General Section Field Description Name The name of the system. System Type The type of the system (whether stand-alone or distributed). Primary Server The primary server of the system. Description The description of the system. Default System Indicates whether the system is a default one. If yes, when you log in to Configuration Hub, this system appears by default. The following conditions apply for a default system: - You can have only one default system in Configuration Hub.
- You cannot delete a default system.
Collectors The number of collectors in the system. Tags The number of tags in the system. Data Stores The number of data stores in the system. Clients The number of clients in the system. Server Time The current time of the server. Server Version The version of the server. Demo Mode Indicates whether the server is currently in demo-license mode. Clustered Indicates whether the server is currently in clustered environment. Table 2. The System Defaults Section Field Description Default Data Store The default data store in the system. A default data store is the one that is considered if you do not specify a data store while adding a tag. For instructions on setting a data store as default, refer to Set a Default Data Store. Default Location The default location in the system. A default location is a server in a system which is considered when you do not specify a location while creating a Data Store. By default, the distributed location on the primary server is the default location. You can, however, set a different default location. To set the default location select  .
.Table 3. The Alarms and Events Section Field Description Alarms Rate The rate at which alarm data is collected in the system. Table 4. The License Section Field Description Historian Tags The number of tags in the system (out of the total number of licensed tags). Note: If this field displays 100 tags and the Users field displays 1 client, you are likely running in demonstration mode and may have incorrectly installed your hardware key.Scada Tags The number of SCADA tags in the system (out of the total number of licensed SCADA tags). Users The number of users in the system (out of the total number of users authorized to access Historian using the software key and license). The number of users that are authorized to access Historian is strictly based on the software key and license. However, if you have utilized your available Client Access Licenses (CAL) and need an additional one to use the system in an emergency, you have an option to reserve a CAL. This reserved CAL allows you to access the server. To do so, provide the reserved CAL to the system administrators and add them to the ih Security Admins group. A system administrator can then connect to Historian in an emergency.
This facility is optional and does not provide a guaranteed connection. It only eliminates the emergency situations when a CAL is preventing you from accessing the system and may not work if there are other conditions. For example, if the Historian server is busy, you will not be able to connect using this feature.
Data Stores The number of data stores in the system (out of the total number of licensed data stores). Calculations Indicates whether the Calculation collector is licensed on the software key. Server to Server Indicates whether the Server-to-Server collector is licensed on the software key. OPC HDA Server Indicates whether the OPC Classic HDA server is licensed on the software key. OPC UA HDA Server Indicates whether the OPC UA HDA server is licensed on the software key. Model Indicates whether the object model is licensed on the software key. Electronic Signature Indicates whether electronic signature is licensed on the software key.
For more information on global security, refer to Strict Authentication.Table 5. The Global Security Section Field Description Security Group Indicates whether you want to use local or domain security groups. Enforce Strict Client Authentication If you enable this option, only known user accounts configured on the Data Archiver server computer will be able to access the Historian server. Enforce Strict Collector Authentication If you enable this option, only known collector connections configured on the Data Archiver server computer will be able to send data to the Historian server. Table 6. The Electronic Signatures/Records Section Field Description Require Point Verification Indicates whether you must enter identifying information whenever you attempt a restricted action. Whenever you attempt to change the system configuration (for the tag, archive, or collector), a tag value, or another record, you must electronically sign the action with a username and password. If the user is authorized to make this change, the identity of the person, the action performed, and the time it was performed, are all recorded in the audit trail.
Note:
- The audit features are not dependent on this feature being enabled. Historian audits all user actions regardless of whether this option is enabled.
- If you plan to create multiple archives at the same time, select the Disabled option.
Enabling electronic signatures and electronic records also requires you to reverify your identity when you use the Historian Excel add-in, modify or create a tag, or import data or messages.
Note:This feature is available only if you have purchased the Electronic Signatures and Electronic Records option.
Verification Message When point verification is enabled, you are prompted to enter the username and password whenever you attempt to perform an action specified as requiring point verification. -
Expand the system in the main section.
A list of servers in the system appears, displaying the following information.
Field Description MACHINE NAME In a stand-alone Historian system, this column displays the host name of the Historian server. In a horizontally scalable Historian system, this column displays the host name of the primary server. STATUS The current status of the Historian system. ARCHIVE COMPRESSION The current effect of archive data compression. At the system level, this value is calculated as the average of the corresponding values of individual servers in the system. If the value is zero, it indicates that archive compression is either ineffective or turned off. To increase the effect of data compression, increase the value of archive compression deadbands on individual tags in the Tags section to activate compression.
In calculating the effect of archive compression, Historian counts internal system tags as well as data source tags. Therefore, when working with a very small number of tags and with compression disabled on data source tags, this field may indicate a value other than zero. If you use a realistic number of tags, however, system tags will constitute a very small percentage of total tags and will therefore not cause a significant error in calculating the effect of archive compression on the total system.
WRITE CACHE HIT RATIO The hit ratio of the write cache in percentage of total writes. At the system level, this value is calculated as the average of the corresponding values of individual servers in the system. It is a measure of how efficiently the system is collecting data. Typically, this value should range from 95 to 99.99%. If the data is changing rapidly over a wide range, however, the hit percentage drops significantly because current values differ from recently cached values. More regular sampling may increase the hit percentage. Out-of-order data also reduces the hit ratio.
CONSUMPTION RATE The rate at which the archive disk space is consumed. At the system level, this value is calculated as the sum of the corresponding values of individual servers in the system. If the value is too high, you can reduce it by slowing the poll rate on selected tags or data points or by increasing the filtering on the data (widening the compression deadband to increase compression).
READ THREAD USAGE The percentage of the read threads currently in use by the system. At the system level, this value is calculated as the average of the corresponding values of individual servers in the system. WRITE THREAD USAGE The percentage of the write threads currently in use by the system. At the system level, this value is calculated as the average of the corresponding values of individual servers in the system. OUT OF ORDER WRITE RATE The number of out-of-order events per minute. At the system level, this value is calculated as the sum of the corresponding values of individual servers in the system. MIN DISK SPACE LEFT The minimum free disk space in MB that must be available on the computer. If the minimum space required is not available when the collector starts, the collector will shut down. FAILED WRITE RATE (EVENTS/MIN) The number of samples that failed to be written per minute. At the system level, this value is calculated as the sum of the corresponding values of individual servers in the system. Since failed samples are a measure of system malfunctions or an indication of offline archive problems, this value should be zero. If you observe a non-zero value, investigate the cause of the problem and take corrective action.
Historian also generates a message if a writing a sample fails. Note that the message only appears once per tag, for a succession of failed writes associated with that tag. For example, if the number displayed in this field is 20, but they all pertain to one Historian tag, you will only receive one message until that Historian tag is functional again.
MEMORY USAGE Indicates how much server memory is being consumed. READ QUEUE RATE (40 MSG/MIN) The number of read requests processed per minute, that came into the archiver from all clients. WRITE QUEUE RATE (MSG/MIN) The number of write requests processed per minute, that came into the archiver from all clients. MESSAGE QUEUE RATE (MSG/MIN) The number of messages processed per minute. READ QUEUE SIZE (EVENTS) The total number of messages present in the Read queue. WRITE QUEUE SIZE (EVENTS) The total number of messages present in the Write queue. MESSAGE QUEUE SIZE (MSG) The total number of messages present in the Message queue. Tip: You can show/hide/reorder columns in the table. For instructions, refer to Common Tasks in Configuration Hub. -
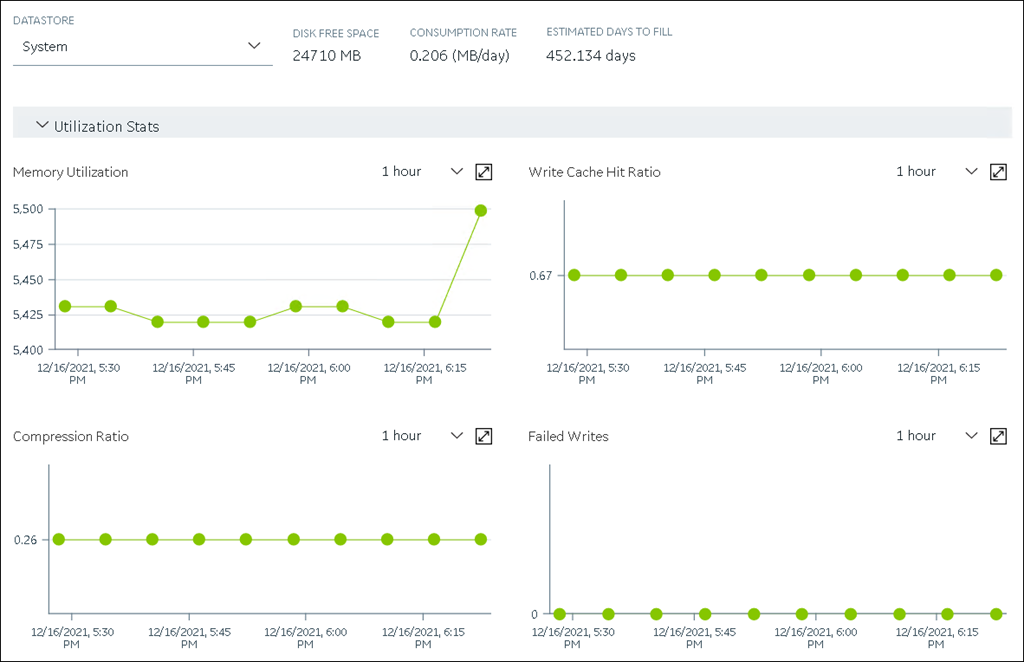
To access the system performance, right-click the system (or select
 ), and then select
View Server Performance.
The <system name> - Performance section appears, displaying graphs for some of the metrics described in the previous table.
), and then select
View Server Performance.
The <system name> - Performance section appears, displaying graphs for some of the metrics described in the previous table.