 Historian
The Performance Tab
The Performance section, shown in the following figure, displays the following information:
- Report Rate
- Compression
- Overruns
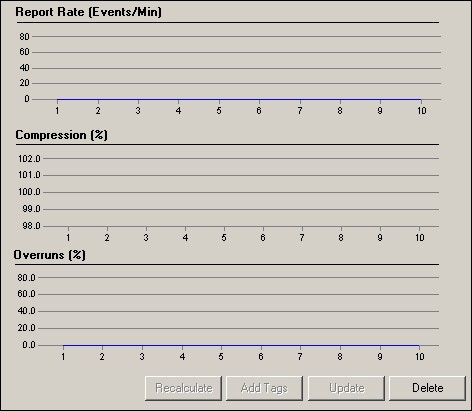
Report Rate: This display is a trend chart that displays the average rate at which data is coming into the server from the selected collector. This is a general indicator of load on the Historian collector. Since this chart displays a slow trend of compressed data, it may not always match the instantaneous value of Report Rate displayed in the Collector panel of the System Statistics page.
Compression: This display is a trend chart that displays the effectiveness of collector compression. If the chart displays a low current value, you can widen the compression deadbands to pass fewer values and increase the effect of compression.
OVERRUN_PCT =OVERRUNS / ( OVERRUNS + TOTAL_EVENTS_COLLECTED )