General Reference
Risk Assessment Data Model
The values that appear on the baseline Risk Matrix come from values that are stored in records in the following families:
- Risk Matrix
- Risk Category
- Consequence
- Probability
- Risk Threshold
- Protection Level
The following diagram illustrates the families that are used to create a Risk Matrix and how they are related to one another in the baseline Predix Essentials database. Predix Essentials leverages its fundamental entity and relationship family infrastructure to store data about the Risk Matrix.

Risk Matrix System Code Tables
The following table lists the System Code Tables that are used by the Risk Matrix feature.
| Table ID | Table Description | Function |
|---|---|---|
| MI_RISK_CATEGORY | Risk Category | Populates the Category Name field in Risk Category records. |
| MI_RISK_CATEGORY_DESC | Risk Category Description | Populates the Category Description field in Risk Category records. |
| MI_RISK_CONSEQUENCE | Consequence | Populates the Name field in Consequence records. |
| MI_RISK_CONSEQUENCE_DESC | Consequence Description | Populates the Description field in Consequence records. |
| MI_RISK_MATRIX_AXIS | Risk Matrix Axis Selection | Populates the Consequence Axis and Probability Axis fields in Risk Matrix records. |
| MI_RISK_MATRIX_SORT_ORDER | Risk Matrix Sort Order for Consequence and Probability | Populates the Consequence Sort Order field in Risk Matrix records. |
| MI_RISK_PROBABILITY | Probability | Populates the Name field in Probability records. |
| MI_RISK_PROBABILITY_DESC | Probability Description | Populates the Description field in Probability records. |
| MI_RISK_PROTECTION_LEVEL | Protection Level | Populates the Name field in Protection Level Slider records. |
| MI_RISK_PROTECTION_LEVEL_DESC | Protection Level Description | Populates the Description field in Protection Level Slider records. |
| MI_RISK_THRESHOLD | Risk Threshold | Populates the Description field in Risk Threshold records. |
| MI_RISK_THRESHOLD_DESC | Risk Threshold Description | This table is not used. |
About the Risk Assessment Window
This documentation uses the term Risk Assessment window to refer to the window that displays the Risk Matrix and other risk information, and which can be accessed in various places throughout the Predix Essentials application. The actual name of the window that appears in the application may be Unmitigated Risk Assessment or Mitigated Risk Assessment, depending on how you accessed the window. Various aspects of the window, including its name, may be customized by an administrative user.
The following image illustrates what the Risk Assessment window looks like when accessed from Asset Criticality Analysis.

The Risk Assessment window contains different items depending upon how you access it. The following table describes the possible items that you might see on the Risk Assessment window.
|
Item |
Description |
Notes |
|---|---|---|
|
Risk Of section |
Displays the name of the risk. |
An administrative user can modify the label of this section using the Risk Matrix datasheet. |
|
Unmitigated Risk Rank section |
Displays a value that is calculated based on the sum of the unmitigated risk values, which are represented by a |
The value in the Unmitigated Risk Rank section is a sum of all of the values on the tabs on the Risk Matrix, multiplied by the appropriate weight and protection level factor (the weight and the protection level factor are configured in Risk Category records and Protection Level records). If the Risk Matrix is configured to use the maximum risk rank, this value is the greatest of all the risk values, not the sum. An administrative user can modify the label of this section using the Risk Matrix datasheet. |
|
Mitigated By section |
Displays the name of the action or the recommendation that mitigates the risk. |
An administrative user can modify the label of this section using the Risk Matrix datasheet. |
|
Mitigated Risk Rank section |
Displays a value that is calculated based on the sum of the mitigated risk values, which are represented by a For a given risk, the mitigated risk rank will be lower than the unmitigated risk rank. |
The value in the Mitigated Risk Rank section is a sum of all of the values on the tabs on the Risk Matrix, multiplied by the appropriate weight and protection level factor (the weight and the protection level factor are configured in Risk Category records and Protection Level records). If the Risk Matrix is configured to use the maximum risk rank, this value is the greatest of all the risk values, not the sum. An administrative user can modify the label of this section using the Risk Matrix datasheet. |
|
Risk Matrix |
Contains a series of tabs that contain a matrix, where you can make selections that the Predix Essentials system will use to calculate the overall risk rank. |
For details about the Risk Matrix, see the topic About the Risk Matrix. |
|
Legend |
Displays the icons that are used to represent mitigated risk values and unmitigated risk values in the matrix. |
None |
|
Basis for Assessment section |
An explanation of the current risk assessment. |
None |
|
Save button |
Saves any changes you have made using the Risk Assessment window. |
None |
|
Cancel button |
Closes the Risk Assessment window, discarding any changes you have made. |
None |
 icon on the matrix.
 icon in the matrix.
Risk Matrix Site Filtering
Site Filtering helps users who are assigned to specific sites find relevant records more easily by preventing users from viewing records associated with sites with which they are not associated. Site Filtering uses a Site Reference Key on families that have site filtering enabled.
Entity families in Predix Essentials, including Equipment and Functional Locations, store the Site Reference Key in the system field MI_SITE_KEY. In the following image, you can see that entity families are related to a Site Reference via the MI_SITE_KEY system field. Each Site Reference is related to a Risk Matrix by the Has Risk Matrix relationship family.

Example: Customizing Row, Column, and Tooltip Labels
Suppose the internal matrix that your company uses to evaluate safety risk looks like this:

You want to begin using Predix Essentials Asset Strategy Management to create Asset Strategies and evaluate risk, and the baseline Predix Essentials Risk Matrix that will be used in ASM looks like this:

You could modify the baseline Risk Matrix so that the probability and consequence labels more closely resemble the Risk Matrix that you are familiar with.
To do so, in the Risk Matrix record, you would need to:
- Select the Hide Numeric Risk Rank check box, which hides the probability values 0.0001 through 1 and consequence values 1 through 1000 from the Risk Matrix.
- Select the Use Maximum Risk Rank check box, which causes the total risk rank value to be the maximum risk rank across all categories (tabs) versus the sum of all risk rank values.
- Select the Use Aliases check box, which allows you to define your own custom labels.
- Type the text
{r}{c}in the Alias Format Mask text box.
Then, in the Probability and Consequence records that are linked to the Safety Risk Category record, you would need to create aliases to specify the labels that you want to see in the Risk Matrix. Specifically, you would need to:
-
Specify the probability values A through E in the Alias field in the Probability records. For example, in the Unlikely Probability record with the Probability value 0.0001, you would type A in the Alias text box.
If you were to view the Risk Matrix, you would see a row with the label Unlikely A, as shown in the following image.

In each remaining Probability record, you would specify the aliases B, C, D, and E.
-
Specify the consequence values 1 through 5 in the Alias field in the Consequence records. For example, in the Very High Consequence record with the Consequence value 1000, you would type 5 in the Alias box.
If you were to view the Risk Matrix, you would see a column with the label Very High 5, as shown in the following image.

In each remaining Consequence record, you would specify the aliases 2, 3, 4, and 5.
When you finished defining the aliases, the completed Safety section in the Risk Matrix would look like this:

About the Risk Matrix System Code Tables
When you create or modify certain records linked to a Risk Matrix record, the values that you can select in the Name and Description lists are defined by System Code Tables. The following table lists these records and the corresponding tables.
|
Record |
Table that defines the Name list |
Table that defines the Description list |
|---|---|---|
|
Risk Category |
MI_RISK_CATEGORY |
MI_RISK_CATEGORY_DESC |
|
Consequence |
MI_RISK_CONSEQUENCE |
MI_RISK_CONSEQUENCE_DESC |
|
Probability |
MI_RISK_PROBABILITY |
MI_RISK_PROBABILITY_DESC |
|
Risk Threshold |
N/A |
MI_RISK_THRESHOLD_DESC |
You can modify or add new entries to these System Code Tables via the System Codes and Tables page within the Risk Matrix Admin section of the application.
For each entry in a System Code Table that defines the Name list, there must be a corresponding entry (i.e., an entry with the same ID) in the System Code Table that defines the Description list. After you select a value in the Name box, the Description box is populated automatically with the value defined by the corresponding system code.
Example
When you create a new Probability record, suppose that the following list appears in the Name box.
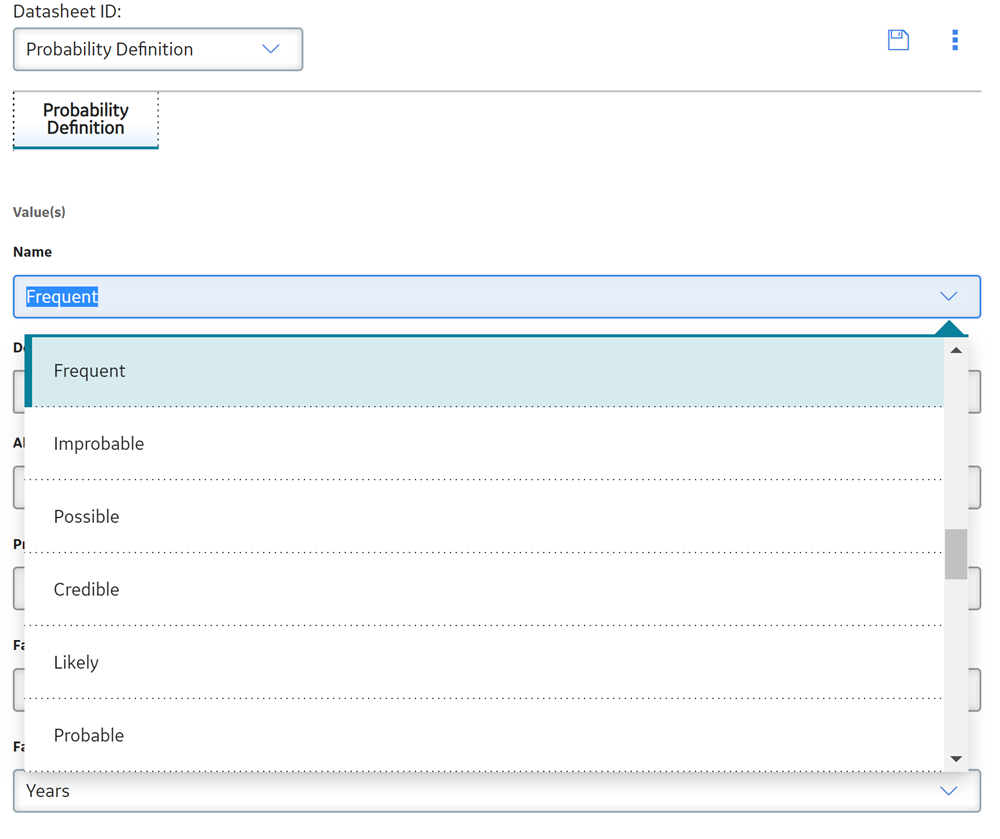
These values are defined in the MI_RISK_PROBABILITY System Code Table, where the values that appear in the Name list are the Descriptions for each System Code.

Further, after you select a value in the Name box, the Description box is populated automatically. The value that is populated is specified by the entry in the MI_RISK_PROBABILITY_DESC table that contains the same ID as the selected entry in the MI_RISK_PROBABILITY System Code Table, where the value populated is stored in the Description field of the System Code.
For example, suppose you create a new Probability record and select Frequent in the Name box. The Description box is populated automatically with the text Likely to occur more frequent than mission time.
The following System Code in the MI_RISK_PROBABILITY System Code Table represents the value Frequent.

The following System Code in the MI_RISK_PROBABILITY_DESC System Code Table has the same ID. The value from this System Code is used to populate the Description box for the Probability record with the text Likely to occur more frequent than mission time.

How the Values in the Risk Matrix are Configured
You can configure each Risk Matrix to display values in certain places to guide users in selecting the appropriate risk values.
Values in a Risk Matrix are determined as follows:
- The Risk Matrix as a whole that appears in the Risk Assessment window is specified by a Risk Matrix record. Risk Matrix records store the values that determine how the Risk Matrix looks. Some of the values in a Risk Matrix record are also used to filter the values that you can select in other records in the Risk Matrix data model.
- Each tab in the Risk Assessment window is specified by a Risk Category record linked to the Risk Matrix record.
- Within the Risk Matrix that appears upon selecting given tab, each row identifies a probability level associated with the matrix. Each probability level is specified by a Probability record. The Risk Category record to which the Probability record is linked determines the section in which the row will appear.
- Within the Risk Matrix that appears upon selecting a given tab, each column identifies a consequence level associated with the matrix. Each consequence level is specified by a Consequence record. The Risk Category record to which the Consequence record is linked determines the section in which the column will appear.
- Within each Risk Matrix, each cell contains a color and a tooltip that explains the threshold within which the risk value falls. The threshold values and corresponding colors are specified by Risk Threshold records that are linked to the Risk Matrix record.
Example
Consider the following Risk Matrix.

The values shown in this Risk Matrix are determined by the following records:
- Risk Matrix records: Determines the look of the Risk Matrix, such as the appearance, order, and axis on which the probability and consequence values appear.
- Risk Category records: There are 4 Risk Category records linked to the Risk Matrix record shown: Safety, Environment, Operations, and Financial. Each Risk Category record corresponds to one tab within the Risk Assessment window. The image shown above displays the values in Probability and Consequence records that are linked to the Safety Risk Category record.
- Probability records: There are 5 Probability records linked to the Environment Risk Category record. Each Probability record corresponds to one row in the Risk Matrix.
The Probability record for the first row shown in this example contains the following values:
- Name: Probable
- Value: 1
-
Description: Likely to occur the same as mission time
Note: This value appears as a tooltip when you pause over the row heading.
-
Consequence records: There are 5 Consequence records linked to the Environment Risk Category record. Each Consequence record corresponds to one column in the Risk Matrix.
The Consequence record for the first column shown in this example contains the following values:
- Name: Very Low
- Value: 1
-
Description: None to minor first-aid
Note: This value appears as a tooltip when you pause over the column heading.
-
Risk Threshold records: There are 5 Risk Threshold records linked to this Risk Matrix record. Each Risk Threshold record corresponds to a range of values that are represented with the same color in the matrix, as well as the risk threshold value that appears when you pause on a cell in the matrix.
The Risk Threshold record representing the cell in this example contains the following values:
- Description: Medium
- Value: 1
- Color: PaleGoldenrodNote: Risk Threshold records represent a range of values. Refer to the topic About Risk Threshold Records for more information about how Risk Threshold records are used.
About Risk Threshold Records
Each Risk Matrix is linked to multiple Risk Threshold records, where each Risk Threshold record corresponds to a range of values that are represented with the same color in the matrix, as well as the risk threshold value that appears when you pause on a cell in the matrix.
When you select a tab on the Risk Matrix, the cells in the matrix are shaded according to the value in that cell and where it falls within the ranges as they are defined in the Risk Threshold records. For example, in the following image, you can see that the cells contain in the number 0.1 and 0.01 are colored LightGreen. If you pause on the cell, the tooltip says Low.

The following Risk Threshold records are provided in the baseline Predix Essentials database to support the baseline Risk Matrix.


From the values in these records, we can determine that the following criteria will be applied to numbers that appear on the baseline Risk Matrix:
- Any number greater than or equal to 0 and less than 1 will be considered low risk. Cells in the matrix that contain numbers greater than or equal to 0 and less than 1 will be shaded LightGreen.
- Any number greater than or equal to 1 and less than 10 will be considered medium risk. Cells in the matrix that contain numbers within this range will be shaded PaleGoldenrod.
- Any number greater than or equal to 10 and less than 100 will be considered high risk. Cells in the matrix that contain numbers within this range will be shaded LightSalmon.
- Any number greater than or equal to 100 and less than 1000 will be considered very high risk. Cells in the matrix that contains numbers within this range will be shaded Salmon.
- Any number greater than or equal to 1000 will be considered extreme risk. Cells in the matrix that contains numbers greater than or equal to 1000 will be shaded IndianRed.
About the Baseline Risk Matrix Records
The baseline Predix Essentials database contains two Risk Matrices:
- Standard Practice
- Default
The following image shows the Standard Practice Risk Matrix.
The Standard Practice Risk Matrix consists of a Risk Matrix record and the following additional records:
- 4 Risk Category records: Safety, Environment, Operations, and Financial.
- 5 Consequence records: Very Low, Low, Medium, High, and Very High.
In the baseline Predix Essentials database, each Consequence record is linked to the following Risk Category records: Environment, Operations, Safety. The Risk Category record Financial is not linked to a Consequence record.
- 8 Probability records: Frequent, Probable, Likely, Credible, Remote, Possible, Improbable, Unlikely.
5 of these Probability records are linked to each Risk Category record, as shown in the following table.
Safety
Environment
Operations
Financial
Probable
Probable
Frequent
Frequent
Credible Credible
Probable
Probable
Remote Remote
Likely
Likely
Improbable Improbable
Credible
Credible
Unlikely Unlikely
Possible
Possible
- 5 Risk Threshold records: Low, Medium, High, Very High, and Extreme.