Overview
Overview of the Graphs Module
Graphs provide a visual representation of data, and are used throughout Predix Essentials. Graphs can be created and modified on the Graph page, but are used throughout Predix Essentials.
Each graph can be created based on a query or dataset. When you create a graph, you will select the type of graph that you want to build and the information that you want to display. At least one field in any graph must be numeric.
Any values that you want to see in a graph must be returned by the query or included in the dataset on which the graph is based. Any changes that you make to the underlying data will be reflected in the graph. For example, if you build a graph based on a query that returns the repair costs for each pump in your system, and then create a new Pump record, the next time you view the graph, the data for the additional Pump will appear.
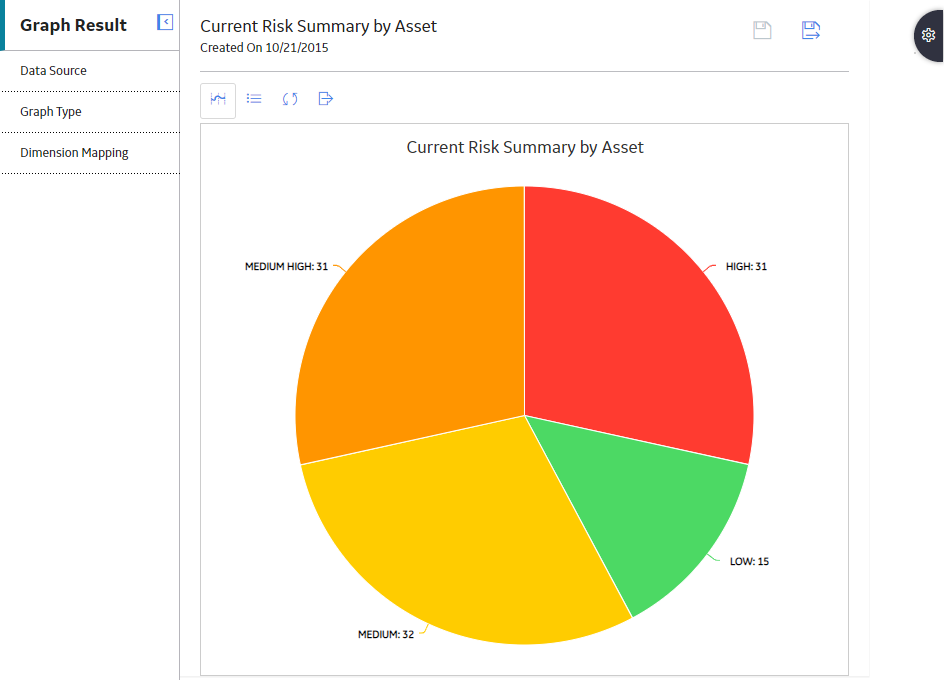
After you create a graph, it appears in the Graph Result workspace. You can view and modify areas on the chart by accessing the Settings pane.
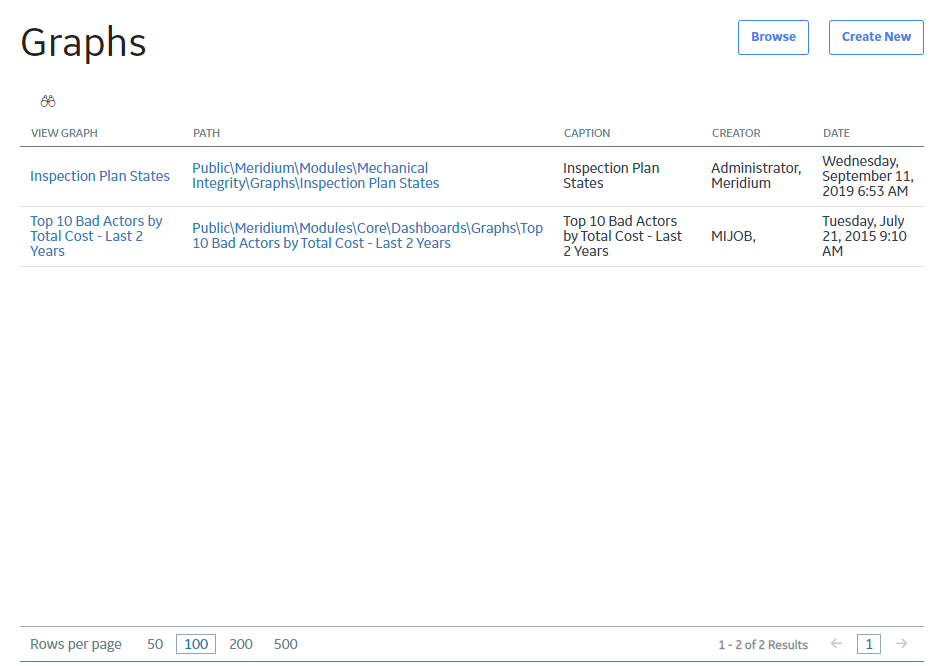
Access the Graphs Page
Procedure
The Graphs page appears, displaying a table of graphs.
Access a Graph
About This Task
This topic describes how to access a graph from the Graphs page. In the Graphs page, you can access a graph that was recently accessed or search for a graph that is stored in the catalog.
Procedure
- Access a graph that was recently accessed.
- In the table, in the Path column, select the link in the row that contains the graph that you want to access.Tip:
- You can select a link in the View Graph column to access the graph in a new, view-only page.
- You can select a link in the Path column to access the full modifiable view of a graph in a new page.
- You can also access the modifiable view from the view-only page.
The Graph Result workspace appears, displaying the graph.
- In the table, in the Path column, select the link in the row that contains the graph that you want to access.
- Access a graph from the catalog.
- Select Browse.
The Select a graph from the catalog window appears.
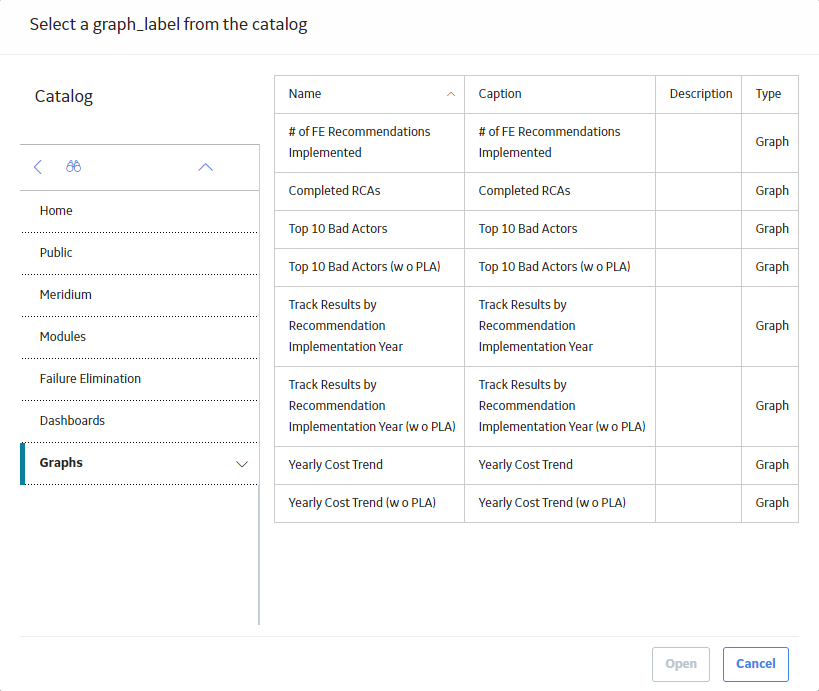
- Select the graph that you want to access, and then select Open.
The graph appears in the Graph Result workspace.
- Select Browse.