Analytics Developer Reference
About Analytics Developer Documentation
Predix Essentials includes some developer documentation to bridge the gap between Predix platform documentation and Predix Essentials user documentation.
Developer documentation included here:
- Clarifies preparation work for privileged users.
- Adds information and procedures for back-end functionality.
- Provides reference material for developers when configuring tenant provisioning.
- Provides reference material for developers when using Predix Essentials APIs.
Sample Data Map for Analytic Template Definition
The data map shows the correlation between the analytic template definition in the user interface and the analytic inputs and outputs.
At least one input is required. An analytic can optionally define outputs, events, or both. Inputs, outputs, and constants in the analytic template definition must match the input parameters, output parameters, and constants specified in the developed analytic to enable its successful deployment.
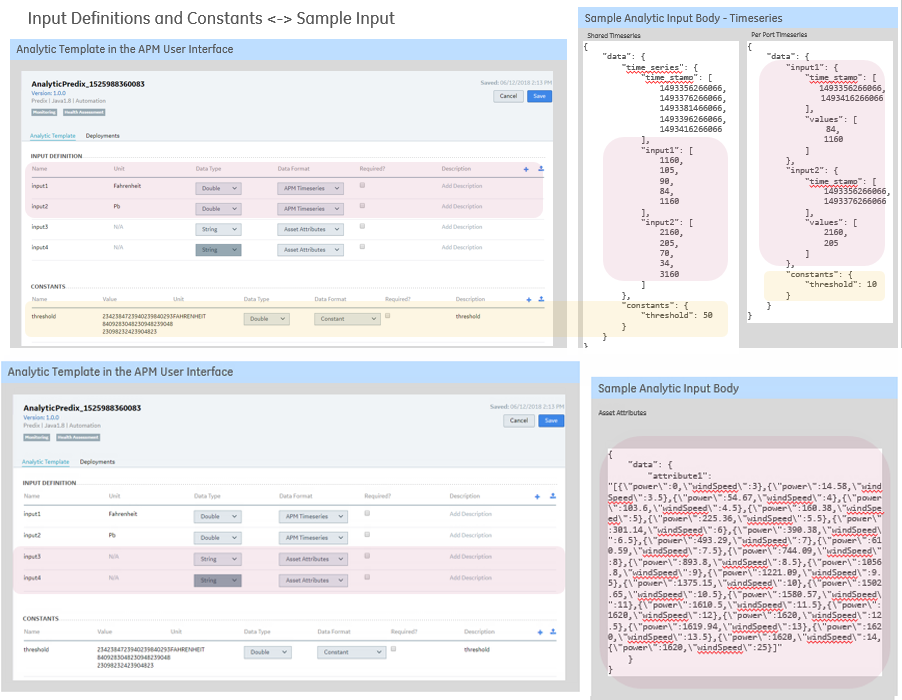
The analytic must follow the JSON contract prescribed by the respective runtime environment and language for successfully running the analytic and generating the output. Template output definitions and constants correlate with the JSON body of outputs:
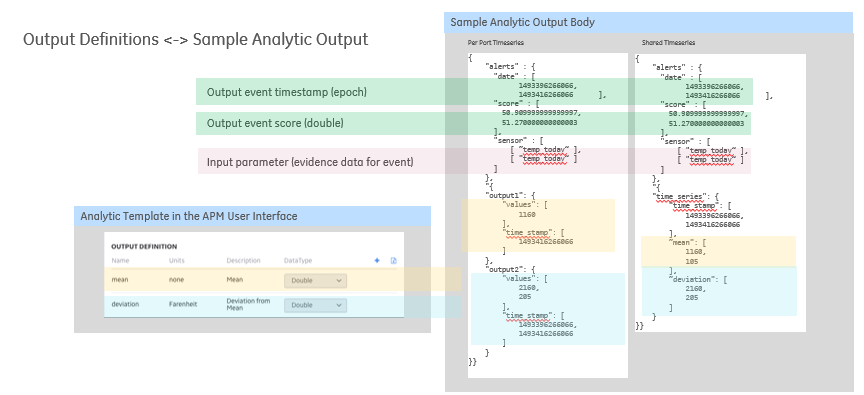
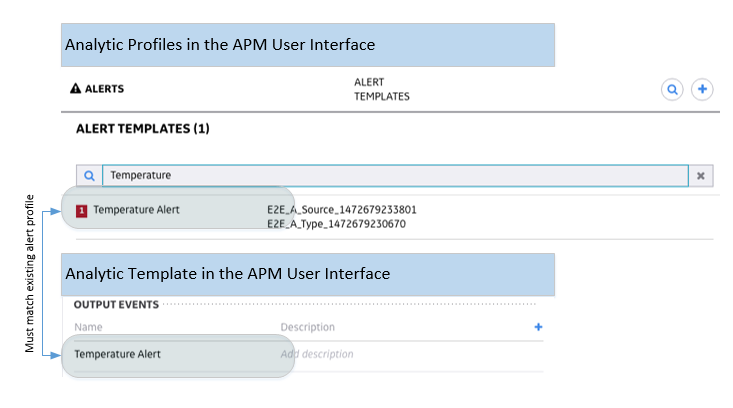
Output events in the analytic template definition map to an existing alert template or the alert template provided as part of the template definition:
Config.json information for developing analytics can be found here: https://github.build.ge.com/212348840/apm-analytic-csv-generator.
Analytic Definition Files
Define Analytic Input CSV
Before You Begin
You have created an analytic in the analytic catalog.
About This Task
Use this procedure if you want to configure multiple inputs through .csv upload. You can skip this procedure if you want to add inputs directly through the UI.
Configure the template to specify input tags for the analytic you are adding or have added to the analytic catalog. This information is needed to run the analytic.
Procedure
- In the Analytic Template section, select
 in the Input Definitionsubsection to download a copy of the .csv template and save it locally.
What To Do Next
Define Analytic Constants CSV
Before You Begin
You have created an analytic in the analytic catalog.
About This Task
Use this procedure if you want to configure multiple constants through .csv upload. You can skip this procedure if you want to add constants on the UI.
Configure the template to specify constants for the analytics you are adding or have added to the analytic catalog. This information is needed to run the analytics.
Procedure
- In the Analytic Template section, select in the Constantssubsection to download a copy of the .csv template and save it locally.
What To Do Next
Define Analytic Output CSV
Before You Begin
About This Task
Use this procedure if you want to configure multiple outputs through .csv upload. You can skip this procedure if you want to add outputs on the UI.
Configure the template to specify output tags for the analytic you are adding or have added to the analytic catalog. This information is needed to run the analytic.
Procedure
- In the Analytic Template section, select in the Outputssubsection to download a copy of the .csv template and save it locally.
What To Do Next
Generate an Alert from an Orchestration
You can generate alerts based on the analytic output from an orchestration associated with a specific asset.
Configure Tags for Alert Generation
- Configure or use an existing Analysis View.
- Configure or use an existing Alert Template.
- Link an Asset Analysis View to an Alert Template.
- Configure and deploy an analytic. Use the Alert Template as the output event.
- Configure an Asset Filter for selection in the orchestration.
- Add an orchestration. Use the Asset Filter for applicability in the orchestration.
- Use the deployed analytic in the Analytic Data Flow in the orchestration.
- During I/O Mapping, select and map the new calculated tag.
- Create a deployment for the orchestration.
- You can run the orchestration using one of three methods:
- On-Demand Run.
- Scheduled Recurrent Runs.
- Event-Based Triggering.
Refer to Scheduling an Orchestration and Event-Based Triggering of an Analytic Execution Using an External Packet (Data Set).
Analytic Orchestration Generated Events and Alerts
The output of the analytic orchestration is stored in time series with a unique tag name and identifier. The alert services supports publishing of common properties and custom properties for output events in an analytic output. These properties are an array of key-value pairs that can be used to supplement the alert information. Predix Essentials uses these output values to generate alerts, some of which can then be accessed via Alerts and other modules.
The following applies to analytic generated alerts:
- You can create alerts in Predix Essentials as output of your analytic deployment for Predix runtime. The following table shows the information you can provide into the analytic output that will be used to create the alert and will appear in the Predix Essentials alerts UI. Using these sample values, you can create output payload from within your analytic that is used by Predix Essentials analytics connectors to ingest alerts into Predix Essentials alerts.
Sample Notes APM Alert "events":[]The list of events and each event results in a Predix Essentials alert. Multiple alerts can be created from a single analytic execution run. If latching is enabled in Predix Essentials alerts, the rules are applied and you may see a single alert with the counter.
"date":1629470412044The date is represented as epoch in UTC. The date is visible in the alerts UI. Alert ingestion contract describes the time of occurrence and time of ingestion. This is the time of occurrence of the alert. "keyValueStore":{ "ke1":"val1", "ke2":"val2" }A set of key-value pairs that are passed during alert ingestion. As Predix Essentials alerts provide rich functionality and new attributes, which you can take advantage of this store to use the new functionality. Predix Essentials analytics will “pass-through” this information. New alert attribute values are introduced periodically and you can use this flexible store to use the new attributes. "sensors":[ "temperature" ]The sensor data that contributed to this alert. You can list the inputs in the analytic template here to specify which input contributed towards this alert. The Alert details page displays the tags of interest and this information enabled you to plot the useful sensor data. "name":"GBOilTempHigh"The name of the alert. The alert name must match the alert template name provided in the analytic template. If an analytic template has multiple alert templates, this value determines which alert is created in Predix Essentials alerts. This name appears in the Predix Essentials Alert inbox. "severity":2This value is used to change and manipulate the severity of the alert from within the analytic. The severity can range from 1 through 5. This severity appears in the Predix Essentials Alert inbox. "templateName":"GBOilTempHigh","templateSuffix":"SageMaker",Refer to the alert name above. You can specify Alert Template name within your alert payload in an analytic output. These values appear in the Predix Essentials Alert inbox. "notes":[ "This is notes for this alert.", "This is another notes for this alert." ]The Notes and Disposition can be specified in your alert payload and Predix Essentials analytics will pass this information along. When an alert is created, the disposition (Claimed, Discarded, etc.) for this alert can be set from within this payload. The Notes and Disposition appear in the Alert details page and Alerts inbox in the Predix Essentials as provided by the analytic output. "date":[ 1629470412044 ], "score":[ ], "sensor":[ [ "temperature" ] ]This is legacy alerts payload which will be ignored. No errors are generated to avoid failures in some legacy environments. No alerts will appear in the alerts inbox. - The key-value defined within the output event that is generated by an analytic, replaces the values provided in the alert template.
| Data Source | Data Type |
|---|---|
| Inputs (for the analytic) | Time series |
| Constants |
|
| Orchestration Output (single-step orchestration) |
|
| Predix Essentials Alerts |
|
When an analytic is deployed, a tagType and tag association is created for each asset if such tagType and tag association does not exist. The tag type name is created using the rule <analytic-name>_<output-name>. The tag association name is created using the rule <asset-source-key>_<analytic-name>_<deploy-cfg-name>_<output-name>.
Pre-Registering Custom Property Keys
For security considerations, prior to passing values as alert attributes via the custom properties of an analytic output, your are required to first register all related keys in custom properties within the specific tenant. This step allows the tenant to recognize these keys as valid, and properly pass the key-values to an alert as an attribute, allowing access and visualization in Predix Essentials Alerts via the grid view. To register key(s) as custom attribute(s) recognizable by Predix Essentials, follow these steps.
- Determine all keys to be registered.
- Register all keys per instructions in the API documentation. Select the link below to access the API documentation:
https://apm-apidocs-preprod.preprod-app-api.aws-usw02-pr.predix.io/alarms/#_create_custom_attribute
- After you have registered all keys, follow the documentation below, regarding the JSON format and output.
Sample Input JSON (Request to Orchestration Engine)
{
"inputData": {
"data": {
"time_series": {
"time_stamp": [
1605339478208,
1605339538208,
1605339598208,
1605339658208,
1605339718208,
1605339778208,
1605339838208,
1605339898208,
1605339958208,
1605340018208,
1605340078208,
1605340138208,
1605340198208,
1605340258208,
1605340318208,
1605340378208,
1605340438208,
1605340498208,
1605340558208,
1605340618208
],
"temperature": [
0,
0,
0,
81.90693333333333,
83.90693333333333,
85.90693333333333,
87.90693333333333,
89.90693333333333,
91.90693333333333,
93.90693333333333,
95.90693333333333,
97.90693333333333,
99.90693333333333,
101.90693333333333,
103.90693333333333,
105.90693333333333,
107.90693333333333,
109.90693333333333,
110,
110
],
"pressure": [
0,
0,
0,
81.9089,
83.9089,
85.9089,
87.9089,
89.9089,
91.9089,
93.9089,
95.9089,
97.9089,
99.9089,
101.9089,
103.9089,
105.9089,
107.9089,
109.9089,
110,
110
],
"rpm": [
0,
0,
0,
91,
91,
91,
91,
91,
91,
91,
91,
91,
91,
93,
93,
93,
93,
93,
99,
99
]
},
"constants": {
"threshold": 110
}
}
}
}Output JSON
{
"alerts":{
"events":[
{
"date":1629470412044,
"keyValueStore":{
             "ke1":"val1",
             "ke2":"val2"
},
"sensors":[
             "temperature"
],
"scanGroupData":{
"test":2.5,
"scores":5.0
},
"name":"GBOilTempHigh",
"severity":2,
"templateName":"GBOilTempHigh",
"templateSuffix":"SageMaker",
"notes":[
             "This is notes for this alert.",
             "This is another notes for this alert."
          ]
}
],
"date":[
       1629470412044
    ],
    "score":[

    ],
    "sensor":[
       [
          "temperature"
       ]
    ]
},
"time_series": {
"time_stamp": [
1605339478208,
1605339538208,
1605339598208,
1605339658208,
1605339718208,
1605339778208,
1605339838208,
1605339898208,
1605339958208,
1605340018208,
1605340078208,
1605340138208,
1605340198208,
1605340258208,
1605340318208,
1605340378208,
1605340438208,
1605340498208,
1605340558208,
1605340618208
],
"mean": [
0,
0,
0,
81.90693333333333,
83.90693333333333,
85.90693333333333,
87.90693333333333,
89.90693333333333,
91.90693333333333,
93.90693333333333,
95.90693333333333,
97.90693333333333,
99.90693333333333,
101.90693333333333,
103.90693333333333,
105.90693333333333,
107.90693333333333,
109.90693333333333,
110,
110,
0,
0,
0,
81.9089,
83.9089,
85.9089,
87.9089,
89.9089,
91.9089,
93.9089,
95.9089,
97.9089,
99.9089,
101.9089,
103.9089,
105.9089,
107.9089,
109.9089,
110,
110,
0,
0,
0,
91,
91,
91,
91,
91,
91,
91,
91,
91,
91,
93,
93,
93,
93,
93,
99,
99
],
"deviation": [
0,
0,
0,
0,
0,
0,
0,
0,
0,
0,
0,
0,
0,
0,
0,
0,
0,
0,
1,
1,
0,
0,
0,
0,
0,
0,
0,
0,
0,
0,
0,
0,
0,
0,
0,
0,
0,
0,
1,
1,
0,
0,
0,
0,
0,
0,
0,
0,
0,
0,
0,
0,
0,
0,
0,
0,
0,
0,
0,
0
]
}
}
Accessing Generated Tags
The newly created tag and its output value can be used to automatically generate alerts, which can then be accessed in an Alert Inbox. Alerts are generated based on the criteria configured for inputs, outputs, and constants in the analytic template. To access the generated Alert in the user interface, the user must link an Alert Template to the Analytic Template. The user will then be able to access the Alert in the user interface for dispositioning and review in other areas. Alerts may require several minutes to generate following completion of an analytic orchestration execution. Alerts automatically create an Alert Analysis that can be accessed and modified in Analysis. Refer to About Alerts and its child topics to address any alerts.
To Access an Alert Analysis, refer to Accessing an Alert Analysis Chart.
To access the tag in a dashboard, you will need to configure a dashboard, card and widget for the selected asset. Refer to Adding, Modifying, and Deleting Dashboards, Adding and Deleting Cards on a Dashboard, and Adding and Deleting Widgets on a Card. When you configure a selected widget, you can use the newly created tag.
Refer to Configure Widgets and its child topics.
Refer to Navigating from a Widget or a specific widget under Configure Widgets.
Event-Based Triggering of an Analytic Execution Using an External Packet (Data Set)
You can implement a REST API to trigger orchestration runs from external data packets.
Use the following REST API to retrieve external data packets, trigger orchestrations, and then process the analytic output data.
One or more data sets that are stored in an external system are provided to the system for processing. This event allows you to trigger an analytic orchestration execution. The system processes each data packet in the order in which it is received.
During processing, the resolveAndExecute API gathers and uses data from the external data packet, and Asset and Time-Series data stores. The orchestrationExecution API is triggered and an output is achieved. The output may be used elsewhere in Predix Essentials.
| API | Description |
|---|---|
resolveAndExecute and orchestrationExecution |
|
| Data Source | Data Type |
|---|---|
| External Data Packet | String |
| Asset Data | String |
| Inputs for Analytics/Orchestrations | Time-Series |
| Outputs for Analytics/Orchestrations | Time-Series |
| Constants for Analytics/Orchestrations | Numeric |
| Orchestration Output | Time-Series |
When an analytic is deployed, a tagType and tag association is created for each asset if such tagType and tag association does not exist. The tag type name is created using the rule <analytic-name>_<output-name>. The tag association name is created using the rule <asset-source-key>_<analytic-name>_<deploy-cfg-name>_<output-name>.
Before You Begin
Make sure you have done the following:
- Set up an Analytic Template.
- Set up an Alert Template.
- Created an analytic that the orchestration can use.
- The APIs can access and read the data from the selected data store.
- An external source containing the data packets for Predix Essentials to use is available. This source can consist of a Postgres table, message queue, or another type that can serve to provide data for
packets.
The data packets must have the following JSON structure:
 [
  {
    "assetUri": "/assets/ddb90c85-64af-386d-a792-1b8733a63369",
    "assetSourceKey": "56000",
    "assetName": "56000",
    "messageDateTime": 1472755021693,
    "assetFilterFields": [
      {
        "name": "ENGINE_FAMILY",
        "value": [
          "CF34"
        ],
        "dataType": "String",
        "priority": 1
      },
      {
        "name": "ENGINE_TYPE",
        "value": [
          "CF34"
        ],
        "dataType": "String",
        "priority": 2
      },
      {
        "name": "AIRCRAFT_FAMILY",
        "value": [
          "B737"
        ],
        "dataType": "String",
        "priority": 3
      },
      {
        "name": "AIRCRAFT_TYPE",
        "value": [
          "B737-800"
        ],
        "dataType": "String",
        "priority": 4
      },
      {
        "name": "CARRIER_CODE",
        "value": [
          "DELTA"
        ],
        "dataType": "String",
        "priority": 5
      }
    ]
  }
]
Prepare and Load the Data
- Predix Essentials Asset - to load the asset-related data.
- Predix Essentials Time-Series - to load the assets time-series related data.
- External data store - to store data packets, or events, which are utilized to initiate analytic orchestration execution.
- Load asset related data to the Predix Essentials Asset data store in your tenant.
- Load time-series data (tags) to the Predix Essentials Time-Series data store.
- Configure a data store outside of Predix Essentials to store external data packets.
The individual data packets are considered the events which are utilized to initiate analytic orchestration execution. APIs use this external data as the criteria for matching the appropriate Asset and Time-Series data in Predix Essentials for analytic orchestration execution.
Initiate Predix Essentials Processing
To initiate processing, call the resolveAndExecute API for each data packet. This will retrieve data packets available in the external queue, then access data from the data packet.
resolveAnd Execute API, the system does the following:- Extract the appropriate Asset data from the report.
- Link and extract the appropriate Asset, Tag, and Time-Series data from Predix Essentials using existing data in Predix Essentials Asset and Time-Series.
- Retrieve the appropriate Inputs, Outputs, and Constants for the Orchestration to be executed.
The resolveAndExecute API passes this data to the execution function of Predix Essentials Analytics (orchestrationExecution API) to initiate execution of the analytic and related orchestrations. Analytics are passed to orchestrationExecution one-by-one and are executed individually.
The JSON output of the orchestration is an output “object” containing the status and results of the orchestration.
The specific output of an analytic is a Time-Series data point.
Sample Response from Orchestration Engine
[
  {
    "assetUri": "/assets/6995a24b-937a-30de-be36-e071a426c13d",
    "assetSourceKey": "56001",
    "assetName": "56001",
    "messageDateTime": 1474504115555,
    "executionOutputs": [
      {
        "executionResult": {
          "orchestrationRequestId": "3869f0ae-f81d-45b7-a70a-6db8b280c742",
          "status": "PROCESSING",
          "orchestrationExecutionStatus":[
            {
              "contextId": "3869f0ae-f81d-45b7-a70a-6db8b280c742-/assets/6995a24b-937a-30de-be36-e071a426c13d",
              "assetId": "/assets/6995a24b-937a-30de-be36-e071a426c13d",
              "status": "PROCESSING",
              "orchestrationStepStatus":[],
              "startTime": null,
              "endTime": null,
              "errorResponse": null
            }
          ],
          "errorResponse": null
        },
        "alertsCreated": false,
        "resultDeletedFromCache": false,
        "isAlertsCreated": false
      }, {
        "executionResult": {
          "orchestrationRequestId": "d0475114-8969-4f81-8bbf-ecca7926b89e",
          "status": "PROCESSING",
          "orchestrationExecutionStatus": [
            {
              "contextId": "d0475114-8969-4f81-8bbf-ecca7926b89e-/assets/6995a24b-937a-30de-be36-e071a426c13d",
              "assetId": "/assets/6995a24b-937a-30de-be36-e071a426c13d",
              "status": "PROCESSING",
              "orchestrationStepStatus":[],
              "startTime": null,
              "endTime": null,
              "errorResponse": null
            }
          ],
          "errorResponse": null
        },
        "alertsCreated": false,
        "resultDeletedFromCache": false,
        "isAlertsCreated": false
      }
    ]
  }
]
Use of Output in Predix Essentials
The specific output of an analytic is a Time-Series data point. Time-Series data points can be used in other areas of Predix Essentials, such as Analysis.
Use the specified tag in the Predix Essentials application to view the value. For instance, you can create a chart in Analysis, or configure a widget in Dashboards.
- Refer to Adding and Deleting an Asset Analysis View in the Help documentation to set up an Analytic Template.
- Refer to Creating, Configuring and Deleting an Alert Template and Adding and Removing Analysis View in an Alert Template in the Help documentation to set up an Alert Template.
Status and Error Notifications
orchestrationExecution API, you can track the status of orchestration execution using two mechanisms:- Sync mode
- The output object from the analytic provides a final response to the orchestration execution (Pass, Fail). Use the asciidoc for
orchestrationExecutionto configure for Sync mode. - Async mode
- You will receive a request ID to monitor the status of orchestration execution using the output object. Then you receive the status of each step in the orchestration using the object to monitor the request. An API can be used to pass the request ID to the system for status. Use the asciidoc for
orchestrationExecutionto configure for Async mode.