Health Indicator Details
About the Health Indicator Trend Chart
The Trend Chart workspace contains a graph that plots the readings values associated with a health indicator source. Specifically:
- If a health indicator source is a record other than an OPC Tag record, the graph displays a history of reading values that are stored in reading source records.
-
If a health indicator source is an OPC Tag record, the graph displays a history of reading values that were collected by the process historian, assuming the following conditions have been met:
-
A connection to the OPC Server is available.
- The OPC Server for the OPC Tag record provides access to historical data.
- The Enabled field in the corresponding OPC System record contains the value True.
- The Data Access field in the OPC Tag record contains one of the following values: Both Historical and Snapshot Data or Historical Data Only.
-
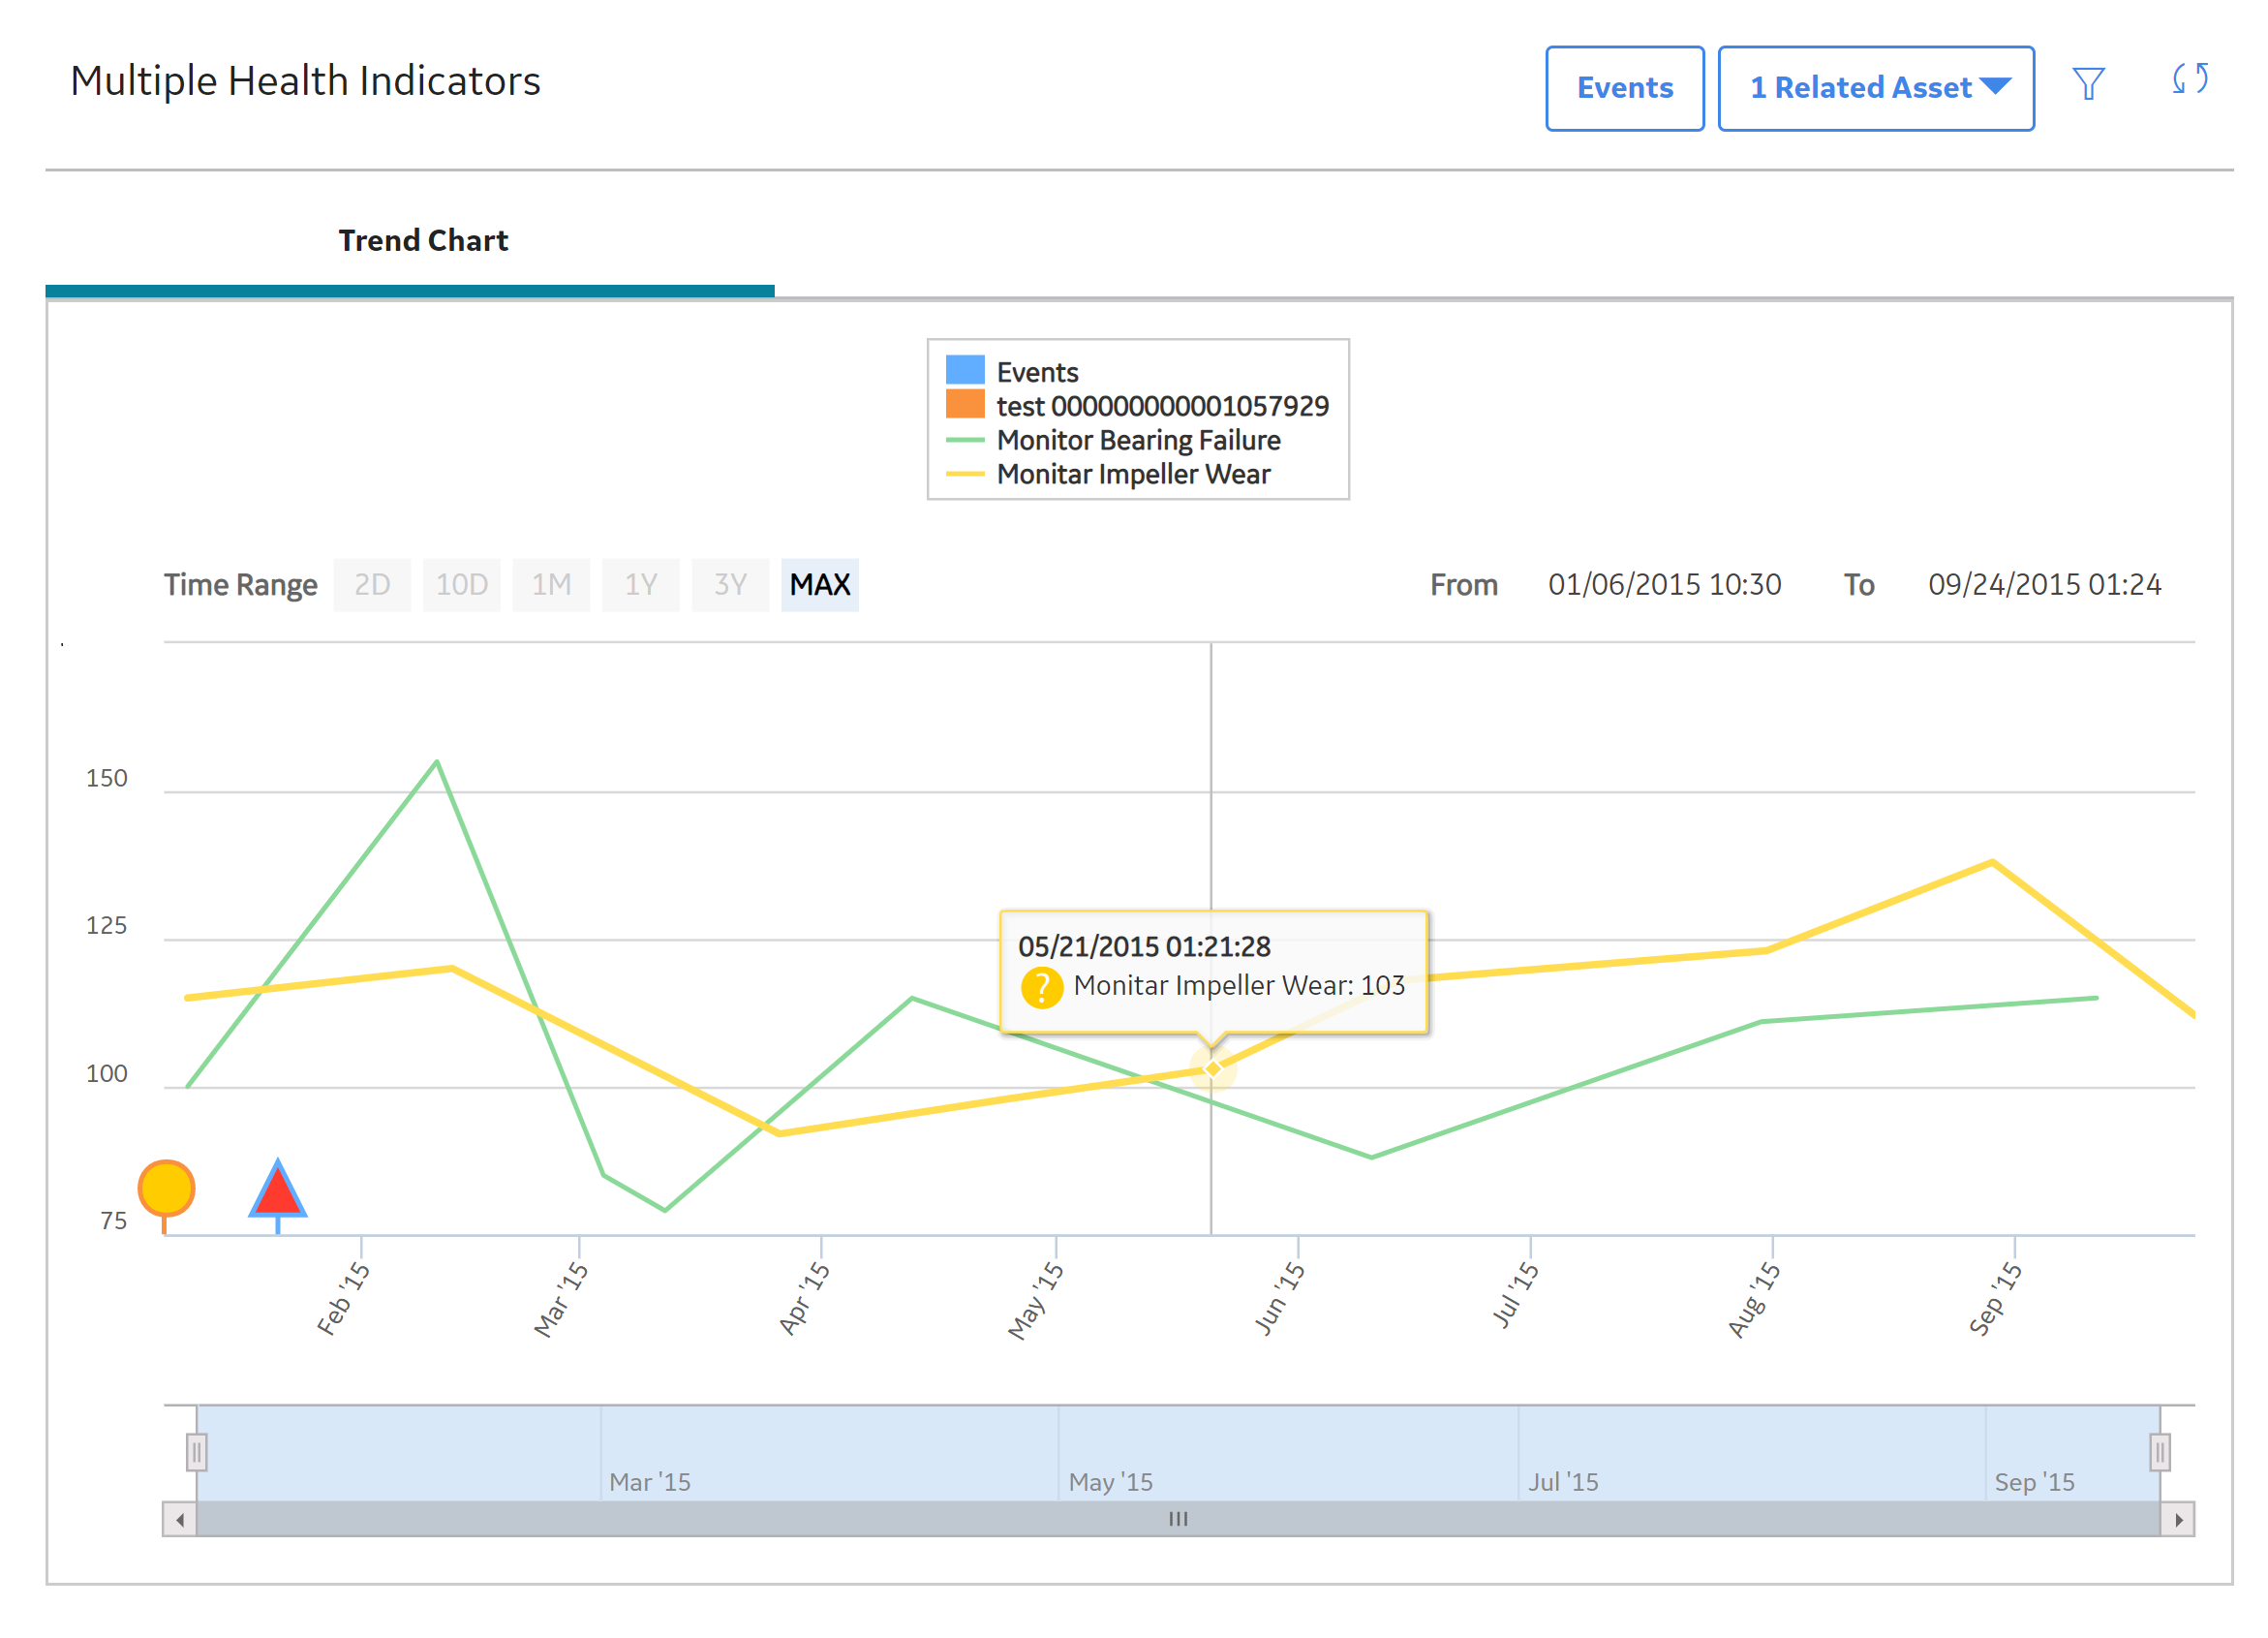
The following image shows an example of the graph when accessed for a multiple health indicators.
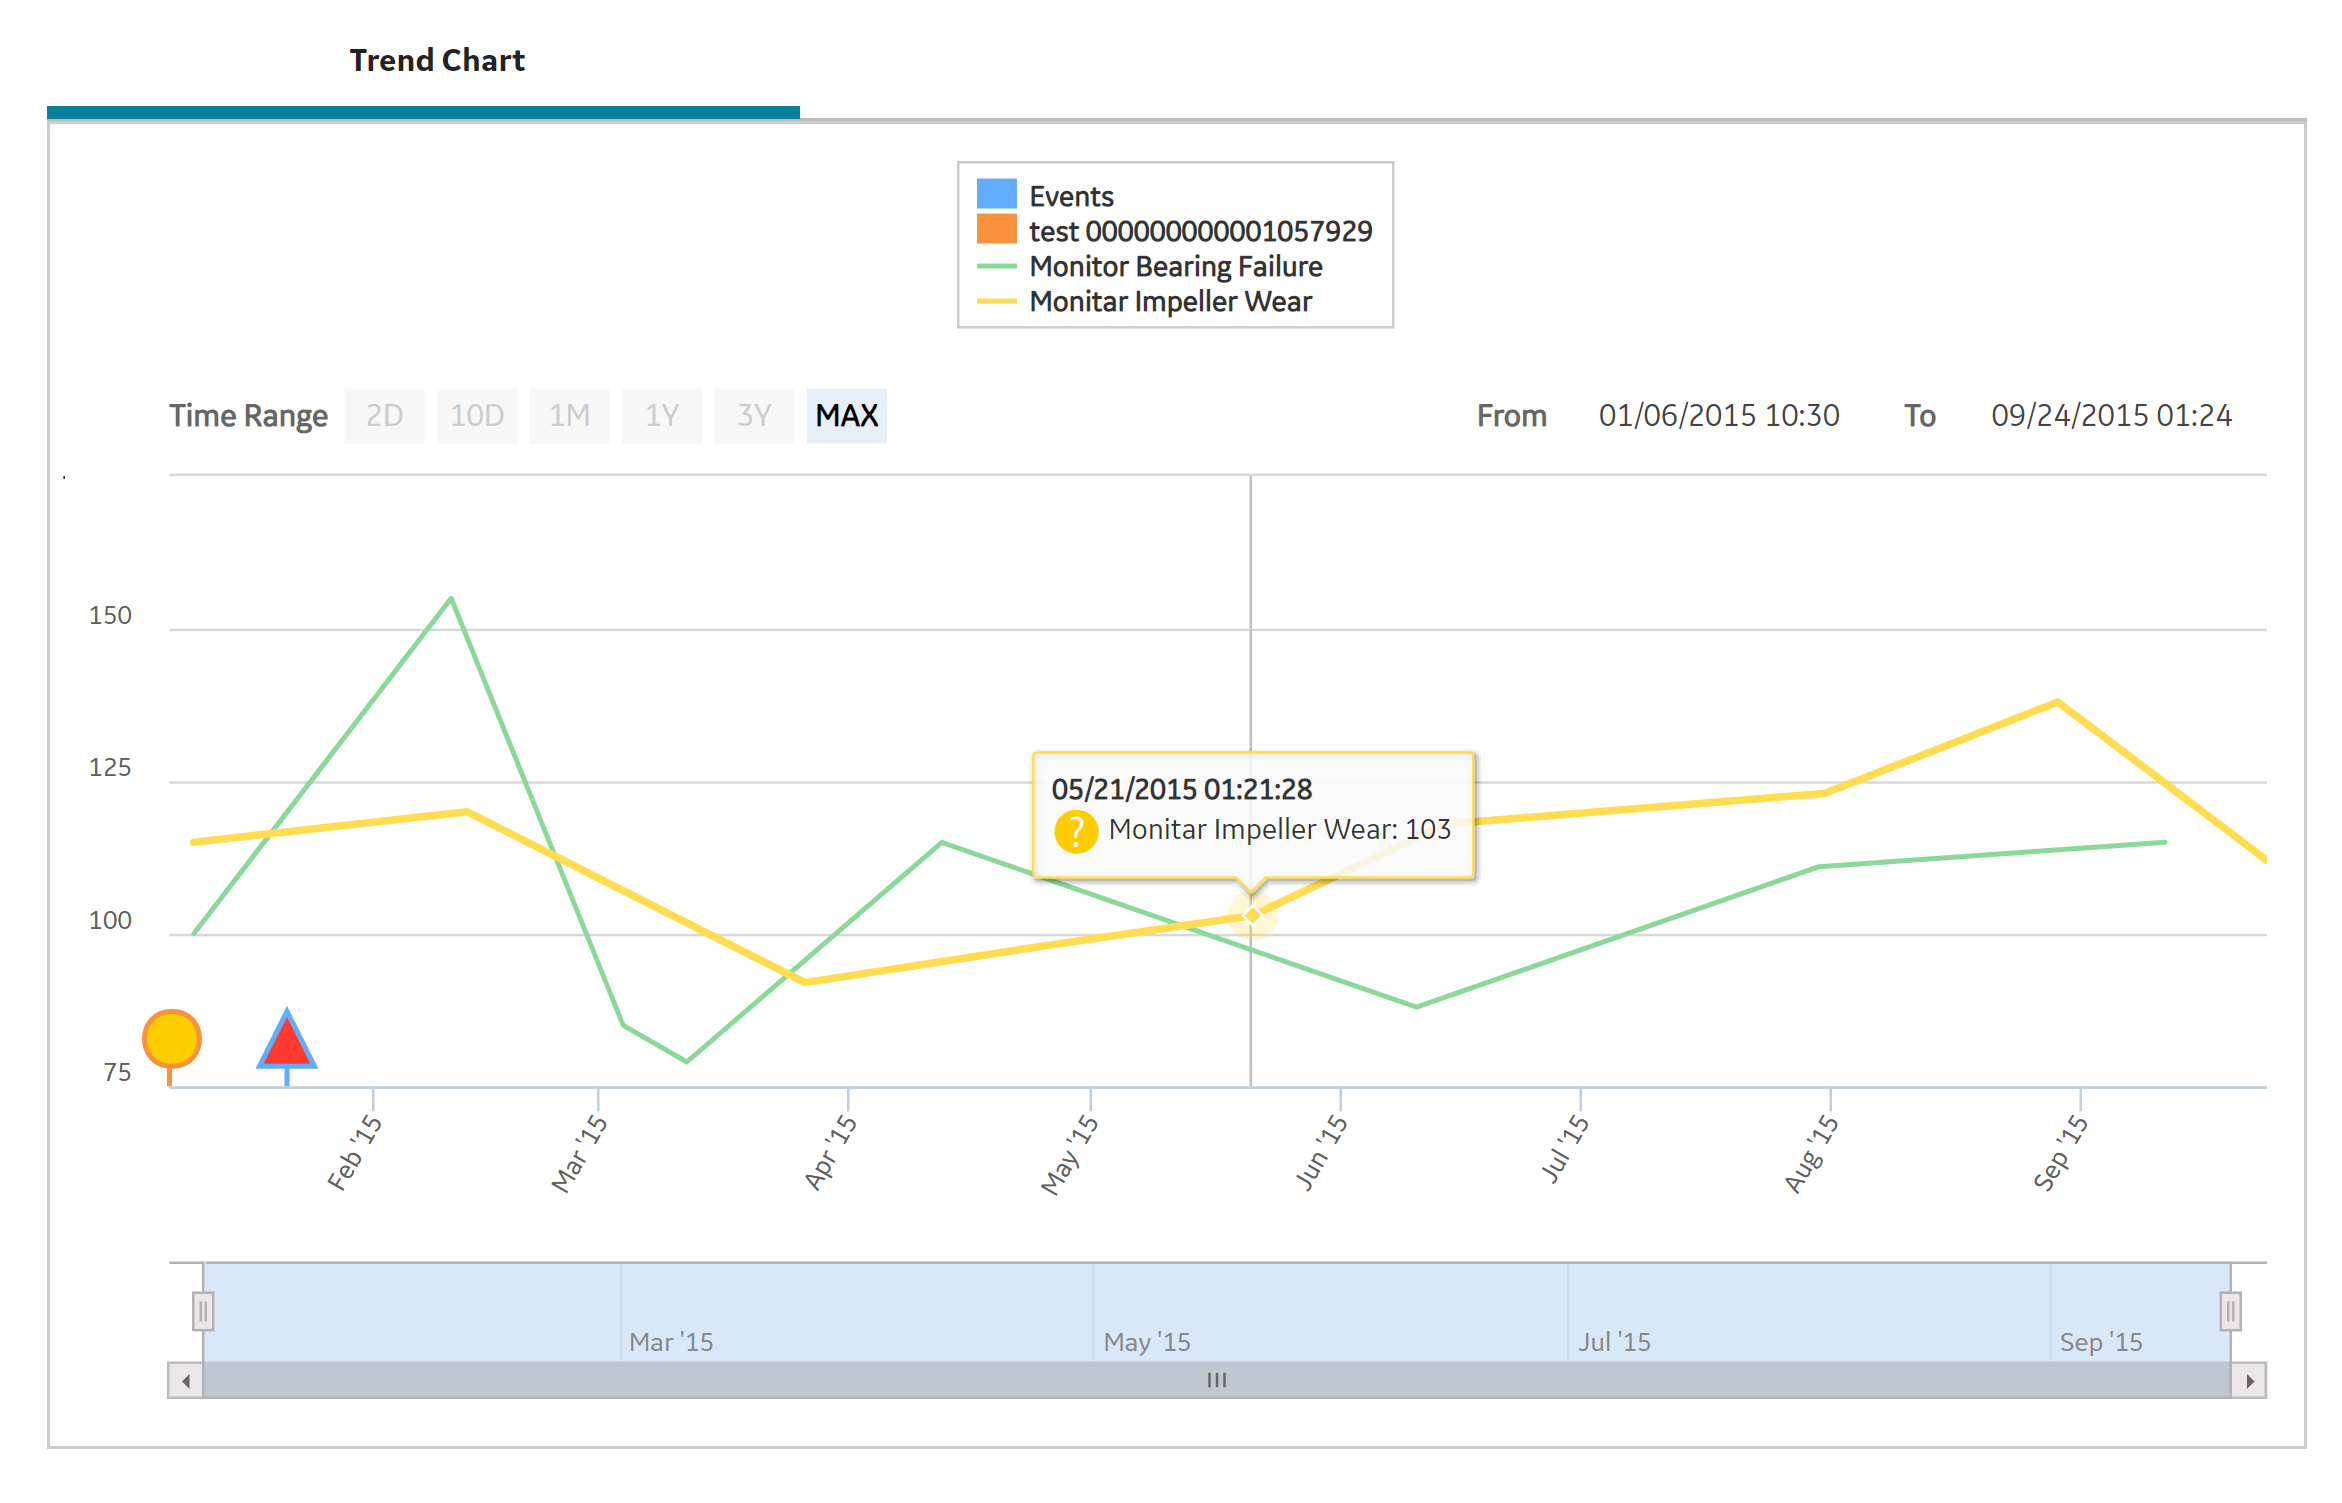
Numeric readings values are plotted on a line graph, while Character readings appear as circle markers along the x-axis. When you point to a line or marker, details of the reading and the related health indicator status appear, as shown in the preceding image.
The secondary graph below the main graph allows you to change the view of the main graph. You can shrink or expand the view by dragging the left or right border of the shaded area. You can drag the shaded area itself to show a different section of the main graph.
- If the health indicator source is a record other than an OPC Tag record, the readings for the previous 12 months will be displayed on the graph, up to a maximum of 10,000 readings. If more than 10,000 readings exist, a message appears indicating that the data has been truncated, and asks whether or not you want to see more data.
-
If the health indicator source is an OPC Tag record, the readings for the previous two days will be displayed on the graph, up to a maximum of 10,000 readings. To view additional data, you can:
- Select the Get More OPC Data button to download additional data in 2-day increments, up to a maximum of 10,000 readings at a time.
- Specify a specific time range to download additional data, up to a maximum of 100,000 readings.
Accessing the Trend Chart for Single vs. Multiple Health Indicator Sources
Depending upon how you access the Trend Chart workspace, some additional features are available.
When you access the Trend Chart workspace for a single health indicator source:
- The shaded areas of the graph show the health indicator limit values and corresponding status colors.
-
If the health indicator source is an OPC Tag record, the value, timestamp, and quality of the DA reading from the process historian appear above the graph. If DA Reading: Unavailable appears, it may mean that a connection to the process historian could not be established or that the information requested does not exist.
When you access the Trend Chart workspace for multiple health indicator sources, you can select the health indicator name in the graph legend to show or hide individual trend lines.
Viewing Events on the Trend Chart
When you display events on the trend chart, triangle markers showing when each event occurred appear for each event along the x-axis of the graph.

The color of each marker corresponds to the severity of the event. You can point to a marker to show details of the event.
Access Trend and Details for Single Health Indicator
About This Task
This topic describes how you can access details (i.e., trend chart of health indicator readings, reading history, and health indicator source configuration) for a single health indicator. You can alternately view a trend chart for multiple health indicators related to the same asset.
Procedure
-
On the Health Summary page, in the This Asset subsection, select the check box next to a health indicator, and then select
 .
.-or-
On the Asset Health Manager Overview page, select a health indicator name in one of the overview lists (i.e., No Status, Normal, Warning, or Alert).
The <Health Indicator Name>:<Description> page appears.
Note: If you select more than one health indicator, the Multiple Health Indicators page appears instead.The date and time that the health indicator was last updated appears under the page heading and a link to open the Health Summary page for the related asset(s) appears on the right side of the page.
The Trend Chart workspace is displayed, which contains a trend chart showing how the health indicator readings have fluctuated over time.

- Select the Reading History tab.
The Reading History workspace appears, which displays the status, timestamp, and value of each reading for the selected health indicator.

Note:- If the health indicator source is an OPC Tag record, the reading values displayed in the grid are the HDA readings directly from the process historian. Readings that are stored in the GE Digital APM database via OPC Reading records can only be viewed using Record Manager.
- By default, rows are sorted by the Date/Time column, with the most recent reading at the top.
- Select the Configuration tab.
The Configuration workspace appears, which displays the name, description, and limit values for the health indicator. You can optionally modify some of these values.

What To Do Next
Access Trend for Multiple Health Indicators
About This Task
This topic describes how you can view a trend chart showing readings for multiple health indicator sources related to the same asset. To view a table of reading history and the health indicator source configuration for a particular health indicator, you must access the health indicator details for the single health indicator.
Procedure
- Above the grid, select .
The Multiple Health Indicators page appears.
Note: If you select just one health indicator, the <Health Indicator Name>:<Description> page appears instead.This page contains a trend chart showing how the health indicator readings have fluctuated over time.
Display Events on the Trend Chart
About This Task
Procedure
- Access the Trend Chart workspace in one of the following ways:
- For a single health indicator.
- For multiple health indicators.
- From another area of GE Digital APM, such as Rounds Designer.
The Trend Chart workspace appears.

- Select the Events button.
The Events Displayed on Trend window appears.

- Select OK.
Triangle markers showing when each event occurred appear for each event along the x-axis of the graph.
The color of each marker corresponds to the severity of the event. You can point to a marker to show the details of the event.
- Optionally, to modify the date range on the Trend Chart workspace, select
 .
.The Filters menu appears.
Modify Health Indicator Source Information
Procedure
- Select the Configuration tab.
The Configuration workspace appears. The top of the workspace contains the name and description of the health indicator. The bottom of the workspace contains one of the following:
- For a health indicator with a source, the bottom of the workspace contains the read-only datasheet of the health indicator source record.
- For a health indicator without a source, the bottom of the workspace contains text boxes where you can modify the limit values for the health indicator.
- Select
 to save any changes.