Overview
Overview of the Thickness Monitoring (TM) Module
Thickness Monitoring (TM) is a module in GE Digital APM that allows you to document, manage, and analyze corrosion data used to predict the remaining usable life for an asset. It provides the tools that you need to monitor the corrosion of the asset in your plant and to take preventative actions that will help you avoid the economic, environmental, and human costs of corrosion-related failures.
Access the Thickness Monitoring Overview Page for a Selected Hierarchy Level
Before You Begin
- You can access the Thickness Monitoring Overview page only if you are a member of one of the following Security Groups:
- MI Thickness Monitoring Administrator
- MI Thickness Monitoring Inspector
- MI Thickness Monitoring User
Procedure
- In the main navigation bar, select
 .The Asset Hierarchy appears.
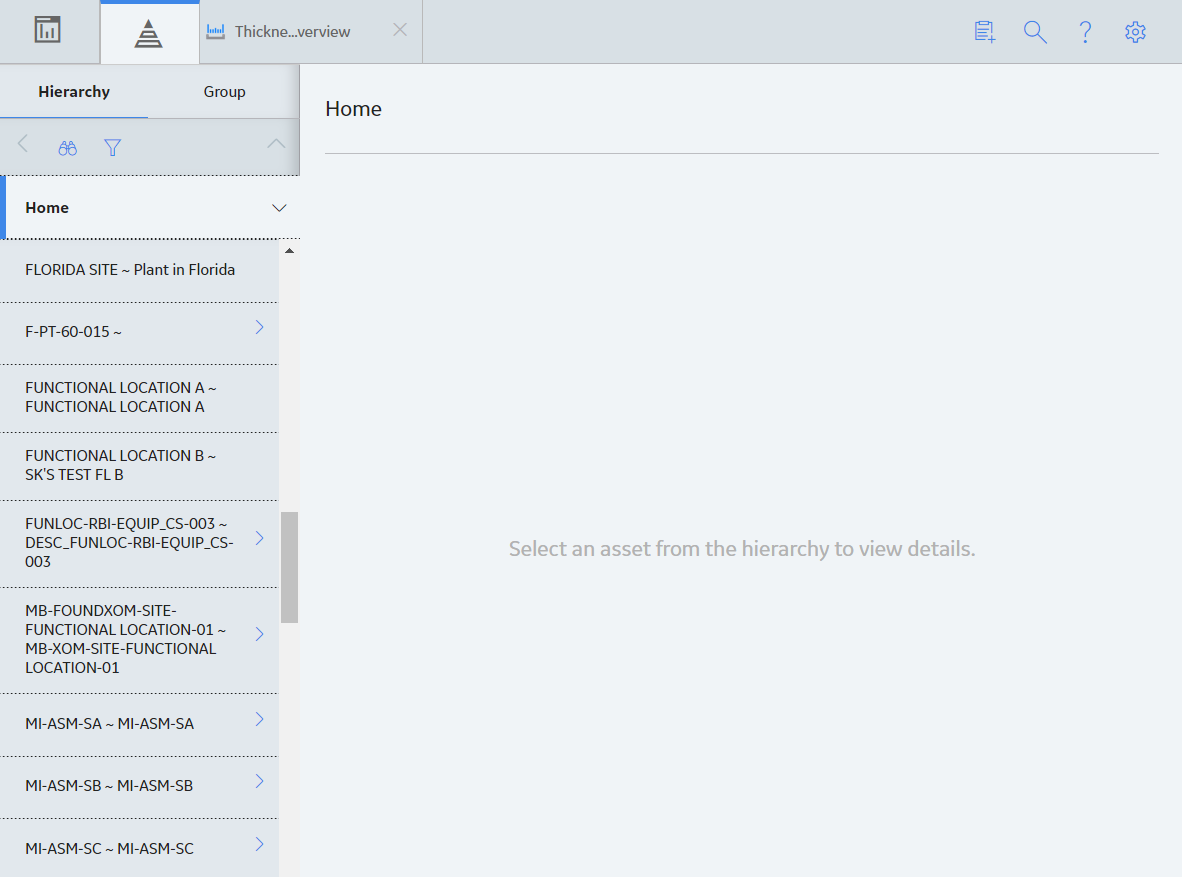
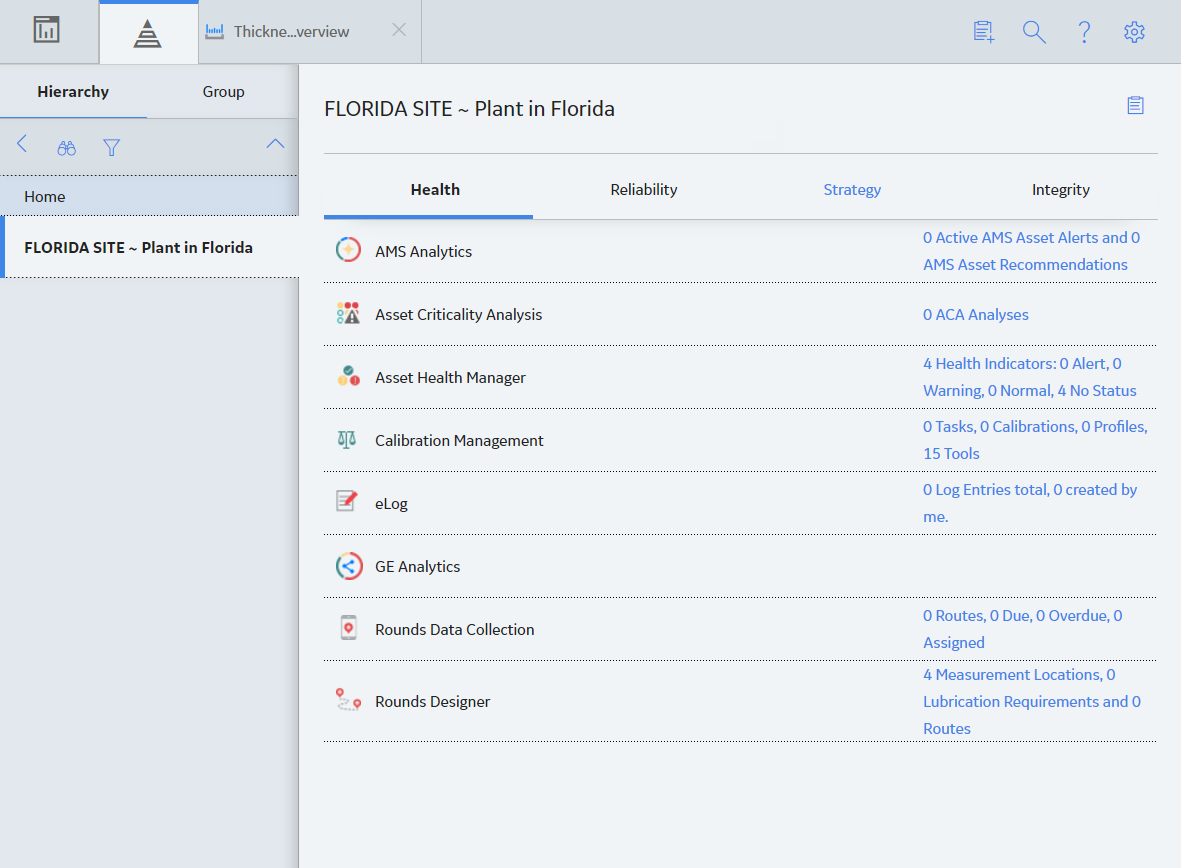
- Navigate to the hierarchy level for which you want to access the Thickness Monitoring Overview page. A list of types of analyses performed on assets in the selected hierarchy level appears in the workspace, in the Health section.
- In the workspace, select the Integrity tab.The Integrity section appears, displaying a list of the functions performed on the selected hierarchy level.Note: In the Thickness Monitoring row, the counts listed for TML Groups and TMLs only lists records that are directly linked to the parent asset.
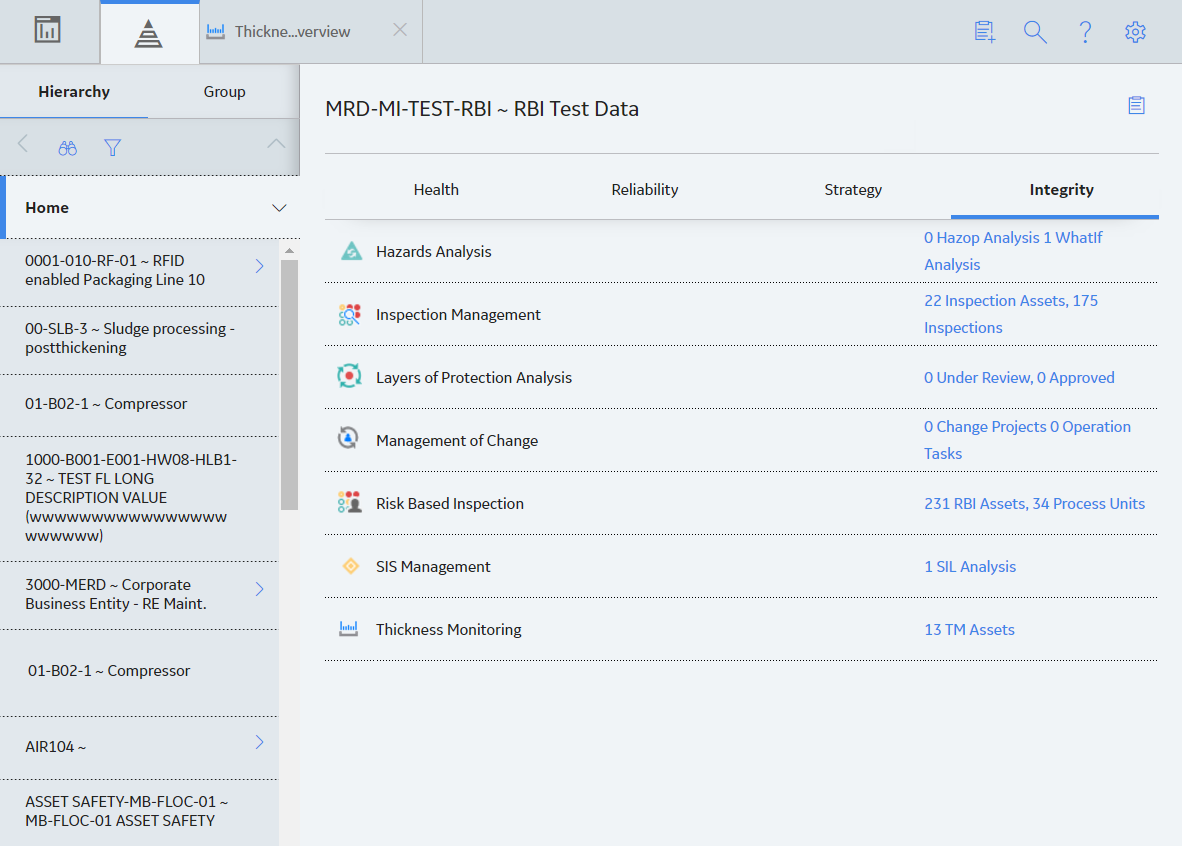
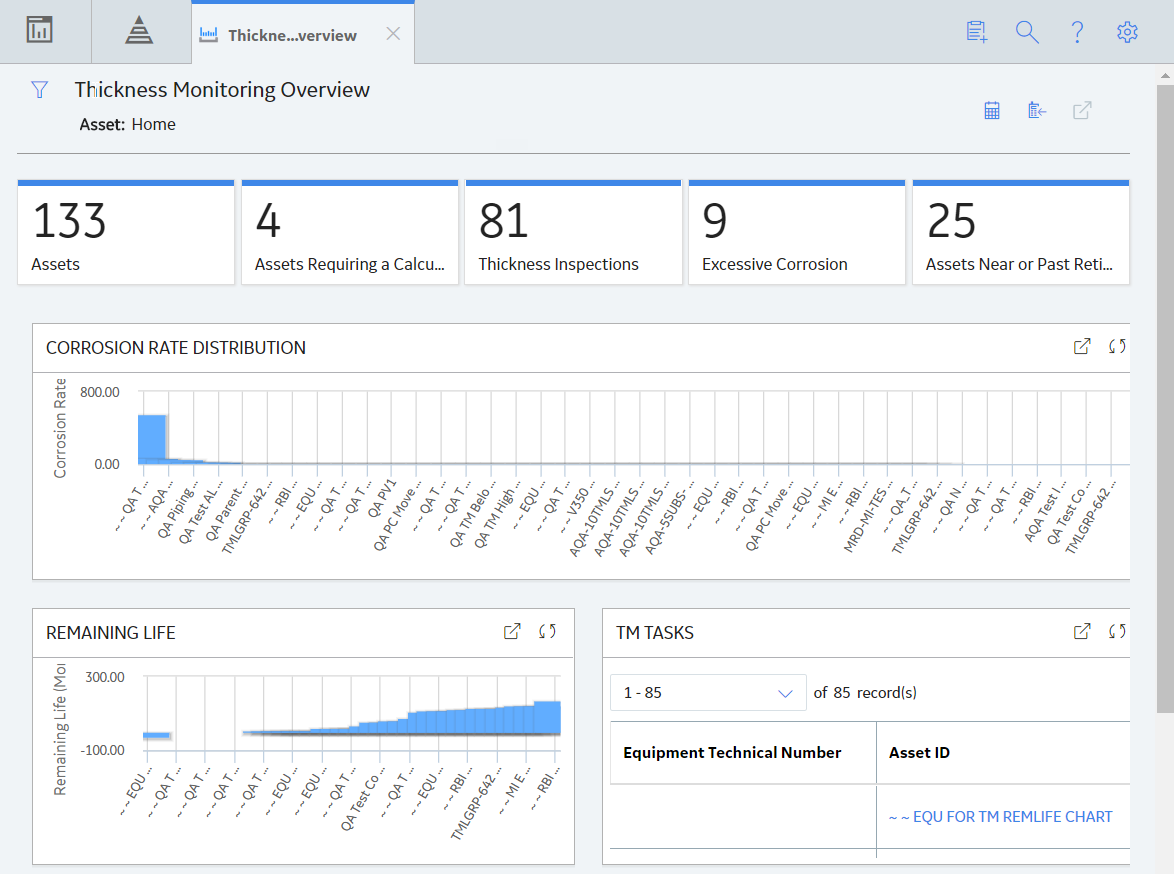
- Select the link in the Thickness Monitoring row.The Thickness Monitoring Overview page appears, displaying the following information that corresponds only to the selected hierarchy level.Note: If you have selected an asset instead of a hierarchy level (that is, functional location), instead of the Thickness Monitoring Overview page, the TM page appears, displaying the Corrosion Analysis Settings workspace.
- The Corrosion Rate Distribution graph: Plots the corrosion rate values of assets.
- The Remaining Life graph: Plots the remaining life values of assets.
- The TM Tasks section: Displays a list of Thickness Monitoring tasks, sorted by the value in the Next Date field.
- The Degradation Distribution section: Displays a list of Degradation Mechanisms and RBI Analyses linked to each asset.
- The Assets section: Displays a list of Equipment and Functional Locations in the selected hierarchy level that are linked to Corrosion Analysis Settings. If you want to include an asset in this list, you will first need to create Corrosion Analysis Settings for that asset. If you have loaded data using the Thickness Monitoring (TM) Data Loaders, then this list is updated to display the assets that have been added or updated via the data loader workbook.
- The Assets Requiring a Calculation section: Displays a list of assets that have not been calculated. If you have loaded data using the Thickness Monitoring (TM) Data Loaders, then this list is updated to display the assets that have been added or updated via the data loader workbook.
- The Thickness Inspections section: Displays the asset controlling next inspection date specified in a Thickness Inspection linked to each asset.
- The Excessive Corrosion section: Displays the controlling corrosion rate values of assets with high rates of corrosion.
- The Assets Near or Past Retirement section: Displays a list of assets that are near or past retirement.
Optionally, if you have configured Thickness Monitoring to link Functional Locations directly with TMLs and TML Groups, in the workspace, you can select to access the Functional Location in the Analysis Overview workspace.
Access the Thickness Monitoring Overview Page for all Hierarchy Levels
Before You Begin
- You can access the Thickness Monitoring Overview page only if you are a member of one of the following Security Groups:
- MI Thickness Monitoring Administrator
- MI Thickness Monitoring Inspector
- MI Thickness Monitoring User
Procedure
- The Corrosion Rate Distribution graph: Plots the corrosion rate values of assets.
- The Remaining Life graph: Plots the remaining life values of assets, up to 180 months.
- The TM Tasks section: Displays a list of Thickness Monitoring tasks, sorted by the value in the Next Date field.
- The Degradation Distribution section: Displays a list of Degradation Mechanisms and RBI Analyses linked to each asset.
- The Assets section: Displays a list of Equipment and Functional Locations. If you have loaded data using the Thickness Monitoring (TM) Data Loaders, then this list is updated to display the assets that have been added or updated via the data loader workbook.
- The Assets Requiring a Calculation section: Displays a list of assets that have not been calculated. If you have loaded data using the Thickness Monitoring (TM) Data Loaders, then this list is updated to display the assets and functional locations that have been added or updated via the data loader workbook.
- The Thickness Inspections section: Displays the asset controlling next inspection date specified in a Thickness Inspection linked to each asset.
- The Excessive Corrosion section: Displays the controlling corrosion rate values of assets with high rates of corrosion.
- The Assets Near or Past Retirement section: Displays a list of assets that are near or past retirement.
What To Do Next
Thickness Monitoring (TM) Workflow
The following workflow provides the basic, high-level steps for using TM. The steps and links in this workflow do not reference every possible procedure.
- Determine the assets in your plant that need to be monitored for corrosion.
- Create corrosion analysis settings for each asset.
- For each asset that will be monitored, identify one or more Thickness Measurement Locations (TMLs) that will be contained in a TML Group.
- After you have identified the TMLs, record Thickness Measurement readings for each TML. These readings can be recorded via data entry or datalogger.
- After you record measurements for the TMLs, calculations are made based on those measurements. TM allows you to select different inspection types for your analyses, as well as use multiple types of analyses at once. Using the measurement data, TM can calculate the corrosion rate, the Next Inspection Date, and the Remaining Life for equipment. The calculations can help determine when to repair or replace the asset.
In addition to facilitating the basic analysis workflow described above, TM also provides other tools and features that help you manage your corrosion data and monitor your asset, including:
- The Minimum Thickness (T-Min) Calculator, which is designed to calculate the minimum thickness for certain types of components. The T-Min value is used to determine the corrosion rate, remaining life, and next inspection date for the component. The T-Min Calculator is available for piping, pressure vessels, and tanks, and is compliant with ANSI B31 (for piping), API 653 (for tanks), and ASME Section VIII DIV 1 and NBIC NB23, API 510 (for pressure vessels).
- An interface for handheld data recorders (dataloggers) manufactured by Olympus and GE. This allows measurement readings that have been recorded in the field to be uploaded automatically to TM. Additionally, data stored in the application can be downloaded to handheld devices.
TM Best Practice
TM Best Practice specifies that you will create analyses for an asset and its components only. You should not create analyses for locations. If you are following Enterprise APM Best Practice, your asset information will be stored in Equipment records, which serve as the root records for your corrosion analyses.
Additionally, TM Best Practice specifies that you can organize your equipment by defining components of the asset. TML Groups should be used to represent the components of the asset at this level.