Overview
Overview of the Metrics and Scorecards Module
Metrics and Scorecards integrates performance management theory with sophisticated data analysis tools to prompt and facilitate actions that can improve organizational performance.
GE Digital APM Metrics and Scorecards uses Microsoft SQL Server Analysis Services that enable the selection of dimensions and measures for easy access to data, multidimensional views, drill-down analysis, Scorecards, and Key Performance Indicators (KPIs). Using GE Digital APM Metrics and Scorecards functionality, you can measure and examine your company's work requests, locations, equipment, work orders, and task information. Through data analysis, you can regulate your maintenance and reliability measurements. Using KPIs, you can track progress by focusing on specific areas within the organization. These KPIs allow you to monitor the most important variables that reflect mission success and company performance.
The primary tools that you will use within GE Digital APM Metrics and Scorecards include:
- Key Performance Indicator (KPI): A list of metrics that are identified as the most important variables reflecting mission success or organizational performance. A KPI is a measure that is monitored over time, at a predetermined frequency. You can create KPIs, schedule updates, add data sources for KPIs, and define alerts for KPIs. A KPI can also be displayed on a dashboard in a dial representation. By monitoring a list of KPIs, you can identify the performance issues.
- Scorecards: Reports that reflect the status of the KPIs. Via Scorecards, users can organize KPIs that help the organization achieve various objectives. The tabular view summarizes the status of multiple KPIs, helping you see the overall trends in a succinct format. You can also drill down into a single KPI to view more details.
- Metric View: A tool for authoring and delivering multidimensional reports. It is a visual representation of a multidimensional cube that has been defined in SQL Server Analysis Services. When you create a Metric View, you can choose the dimensions and measures from the cube. After the Metric View is created, it can be presented in charts or in a tabular format. By default, the Metric View is presented in chart format.
- Key Performance Indicator (KPI): A list of metrics that are identified as the most important variables reflecting mission success or organizational performance. A KPI is a measure that is monitored over time, at a predetermined frequency. You can create KPIs, schedule updates, add data sources for KPIs, and define alerts for KPIs. A KPI can also be displayed on a dashboard in a dial representation. By monitoring a list of KPIs, you can identify the performance issues.
- Scorecards: Reports that reflect the status of the KPIs. Via Scorecards, users can organize KPIs that help the organization achieve various objectives. The tabular view summarizes the status of multiple KPIs, helping you see the overall trends in a succinct format. You can also drill down into a single KPI to view more details.
The following table provides a list of functionality that is accessible depending on the status of the license.
| Functionality | License Status: Active | License Status: Inactive |
|---|---|---|
| Metrics Views | Create, Update, Delete, and View | View |
| Scorecard | Create, Update, Delete, and View | View |
| Key Performance Indicators | Create, Update, Delete, and View |
|
Metrics and Scorecards Features
The Metrics and Scorecards module allows you to work with threetwo distinct items: Scorecards, Key Performance Indicators (KPIs), and Metric Views.
GE Digital APM leverages its fundamental entity and relationship family infrastructure to store data related to Scorecards, Metric Views, and KPIs. It may be useful to remember that Scorecards, Metric Views, and KPIs are simply customized views of individual records and Catalog items that work together.
- One or more KPI records.
- One or more KPI Objective records.
- One or more KPI Perspective records.
- One or more KPI records.
- One or more KPI Measurement records.
- One or more Scorecard records.
- A SQL Server connection, which is defined in an SSAS Servers record.
- An Analysis Services Cube, whose connection information is stored in the Analysis Services Cube record.
Access the Metrics and Scorecards Overview Page
About This Task
Procedure
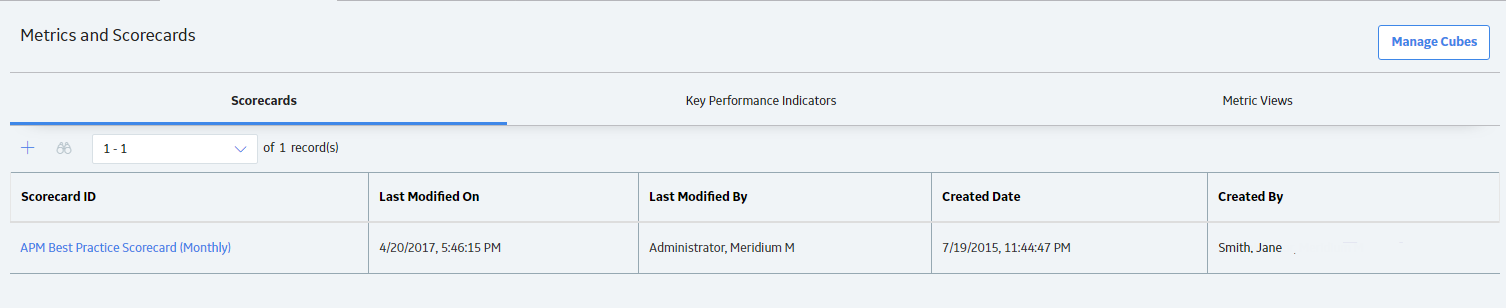
The Metrics and Scorecards page displays the following sections:
- Scorecards: Displays a list of existing scorecards. In the Scorecards section, you can create a new Scorecard or view an existing Scorecard.
- Key Performance Indicators: Displays a list of existing KPIs. In the Key Performance Indicators section, you can create a new KPI or view an existing KPI.
- Metric Views: Displays a list of existing Metric Views. In the Metric Views section, you can create a new Metric View or view an existing Metric View.Note: No data is available for the existing Metric Views because the SSAS cubes are not supported in Predix Essentials.
To search for a specific Metric View, Scorecard, or KPI, you can select the search button ( ), and then enter the name of a Metric View, Scorecard, or KPI.
When you select an item listed in the any of the threetwo sections, the details appear on a new page.
Metrics and Scorecards Workflow
The following workflow provides the basic, high-level steps for using this module. The steps and links in this workflow do not necessarily reference every possible procedure.
- Add a cube.
- Create a Metric View by using the cube.Note: Interaction with the view or design page of a Metric View, such as drill through, is not available on GE Digital APM mobile application.
- Create a KPI by providing the following details:
- Adding a datasource.
- Scheduling a KPI and setting the alerts.
- Create a Scorecard.
- Add the KPI to the dashboard as widget.