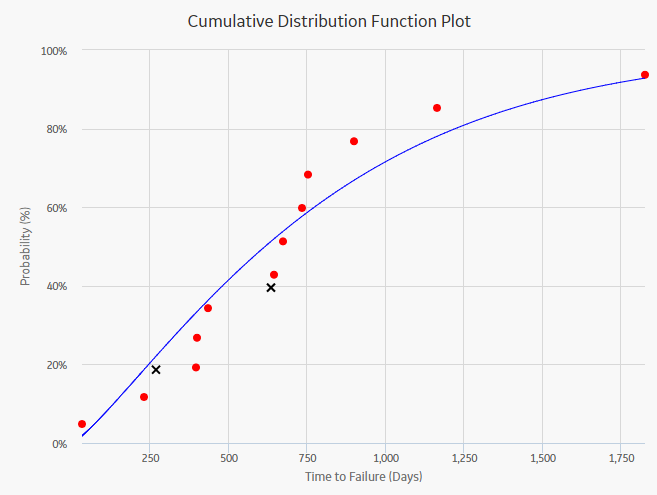
The Cumulative Distribution Function (CDF) Plot shows the probability of an event occurring over time, as displayed in the following image. The dotted line illustrates that at a given time, you can determine the probability of failure or unreliability.

Here, the term Probability is used to describe the percent of the total population that will fail by time (t). Time used here refers to life data, not Calendar data. The graph type is lin-lin with data overlay and confidence limits.
Note: Interaction with graphs is not available on touch-screen devices.
The reliability of an asset or group of assets can be evaluated by subtracting the Probability of Failure from 1 (R = 1-P). The Probability of Failure Plot displays the probability that the unit will survive up to a given age. The Failure Rate Plot displays the Failure Rate for a given asset or group of assets based on the System Reliability calculations.
The Cumulative Distribution Function Plot answers the question, "What is the probability of failure by time(t)?" The CDF curve is the area under the PDF curve. The Cumulative Distribution Function Plot accumulates all probability of failure up to the point in time in question. Since the number of failures increases with increasing time, the slope of the curve is always positive, always increasing.
In addition, you can select one or more Reliability Distribution Analyses from the list of analyses and generate a composite plot to compare the competing failure modes. Competing failure modes occur when the failure pattern, due to one type of fault, dominates the survivor population from another type of fault. If the failure patterns overlap like this, then they are said to be competing failure modes.
Note: If you selected to use a Confidence Level, confidence intervals are included in the analysis calculations and the upper and lower limits appear on the graph.
When you access a CDF graph, GE Digital APM displays auto-censored datapoints that represent the life between the date of the failure and the end of the analysis.
While accessing a CDF graph, you can:
Copyright © 2018 General Electric Company. All rights reserved.