Select the Reliability Distribution tab.
A list of Reliability Distribution Analyses available in the database appears.
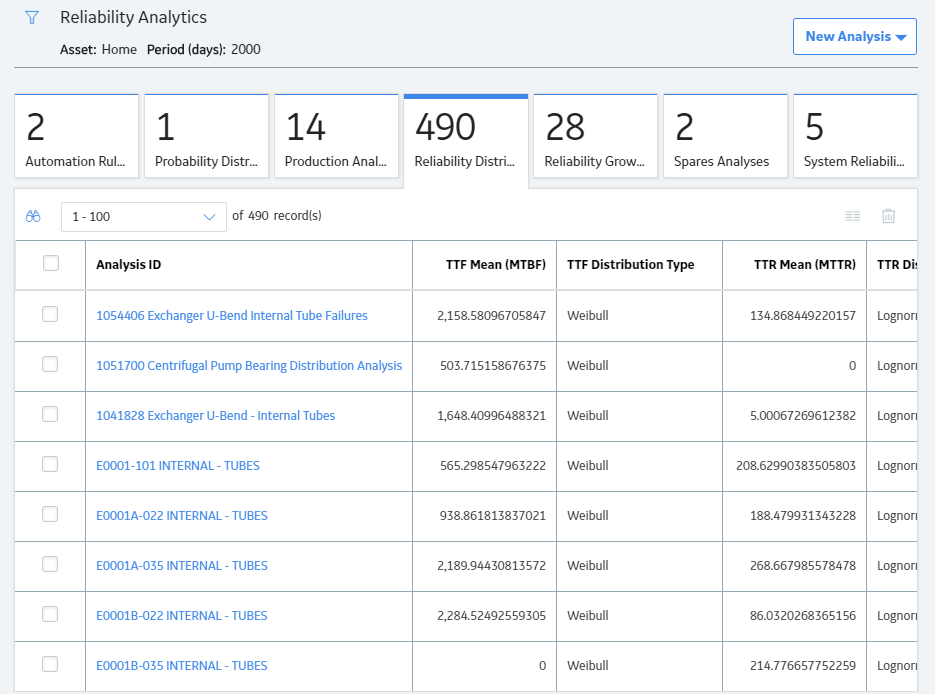
Select the Reliability Distribution Analysis whose details you want to view.
The Analysis Summary workspace for the selected analysis appears, displaying the following sections:
- Time to Failure Distribution: Provides a summary of details for the Time to Failure (TTF) distribution, which calculates the expected time to failure for a non-repairable system (i.e., the failed component must be replaced). This is based on the time between when the component or group of components was placed into service and when failure(s) occur. The period which is being analyzed can end at a fixed date or time, or after a fixed number of failures have taken place. TTF may be expressed as days, hours, cycles, units processed, and so on. This section also displays the Probability Plot and Failure Rate Plot.
- Time to Repair Distribution: Provides a summary of the details for the Time to Repair (TTR) distribution, which calculates the time it took to repair an asset. This time is generally referred to as the time from when an item fails to when it is returned to productive service. This section also displays the Probability Plot and Failure Rate Plot.
- Failure Data: Displays the failure history by asset in a chart.
The Analysis Summary workspace contains the following sections at the bottom of the workspace:
Note: If Time to Failure Distribution tab is selected, the bottom section displays information associated with the Time to Failure Distribution. If Time to Repair Distribution tab is selected, the bottom section displays information associated with Time to Repair Distribution.
- Distribution Options: Contains the summary of distribution properties for the selected Reliability Distribution Analysis and allows you to modify these properties.
- Distribution Parameters: Contains the distribution parameters, which are determined by the distribution type.
- Goodness of Fit Test: Contains the results of the Goodness of Fit (GOF) test and includes the Statistic, P-Value and Passed fields.
-
Analysis Basis: Displays the number of failures contained in the Failure Data that were used to generate MTBF, the number of those failures from the data that were censored when the calculations were last performed, and the number of pieces of equipment contained in the Failure Data. The Failure Type that was selected when creating the analysis is also listed in this section.
- If the analysis is based on the Failures With Replacements failure type, the following information is displayed: Components are always replaced after each failure.
- If the analysis is based on the Failures Without Replacements failure type, the following information is displayed: Components are not automatically replaced after each failure.
The left pane contains the following tabs:
- Probability Plot: Contains the Probability plot for the selected analysis.
- Failure Rate Plot : Contains the Failure Rate plot for the selected analysis.
- PDF Plot: Contains the Probability Density Function plot for the selected analysis.
- CDF Plot: Contains the Cumulative Distribution Function plot for the selected analysis.
- PM optimization: Contains the optimal preventive maintenance interval and a graphical plot of the Planned Cost, Unplanned Cost, and Total Cost if a PM Optimization has been previously performed. The Optimal Value inflection point is identified on the total cost curve.
- Failure Probability : Contains the Failure Probability information in a grid, which is calculated by the system using the Future Age that you specify and the information available for the Distribution Analysis.
