The Performance Tab
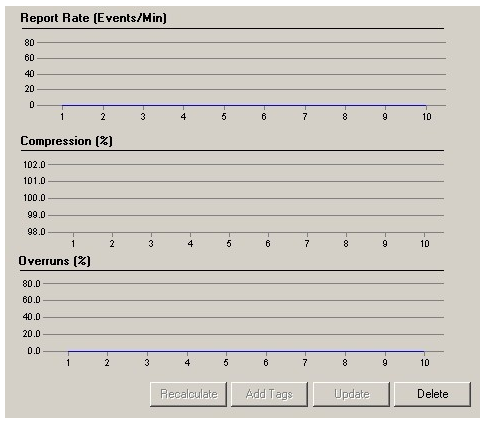
The Performance tab, shown in the following figure, displays the following information:
- Report Rate
- Compression
- Overruns
Note: Not all reports in the Reports tab are available for all collectors.
Report Rate
This display is a trend chart that displays the average rate at which data is coming into the server from the selected collector. This is a general indicator of load on the Historian collector. Since this chart displays a slow trend of compressed data, it may not always match the instantaneous value of Report Rate displayed in the Collector panel of the System Statistics screen.
Compression
This display is a trend chart that displays the effectiveness of collector compression. If the chart displays a low current value, you can widen the compression deadbands to pass fewer values and increase the effect of compression.
Overruns
This trend chart displays the value at which data overruns are occurring. This value is calculated by the following equation:
OVERRUN_PCT =OVERRUNS / ( OVERRUNS + TOTAL_EVENTS_COLLECTED )