The data dashboard working to protect the Great Barrier Reef


The first such tool, the eReefs Marine Water Quality Dashboard, launched in 2014. It “is about being able to understand water quality in real time and at the scale of the whole Great Barrier Reef, and to link it to practices up in the terrestrial catchments, where we know the main factors are in relation to the degradation of water quality,” explains Cedric Robillot, a scientist and the Brisbane-based project director of eReefs. “There was nothing available to provide such a dynamic and whole-of-system snapshot of water quality on the Reef, so the Dashboard had to mobilise new and innovative approaches.”
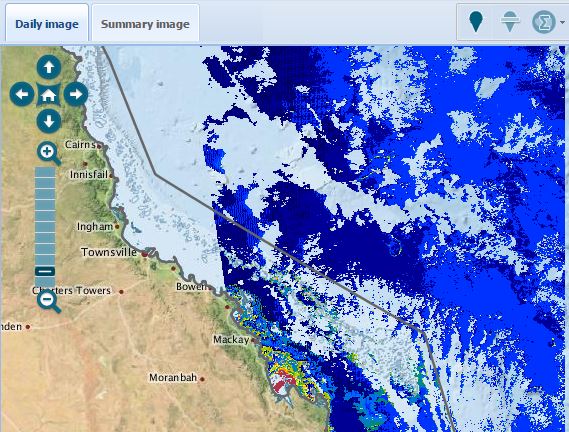 eReefs Marine Water Quality Dashboard
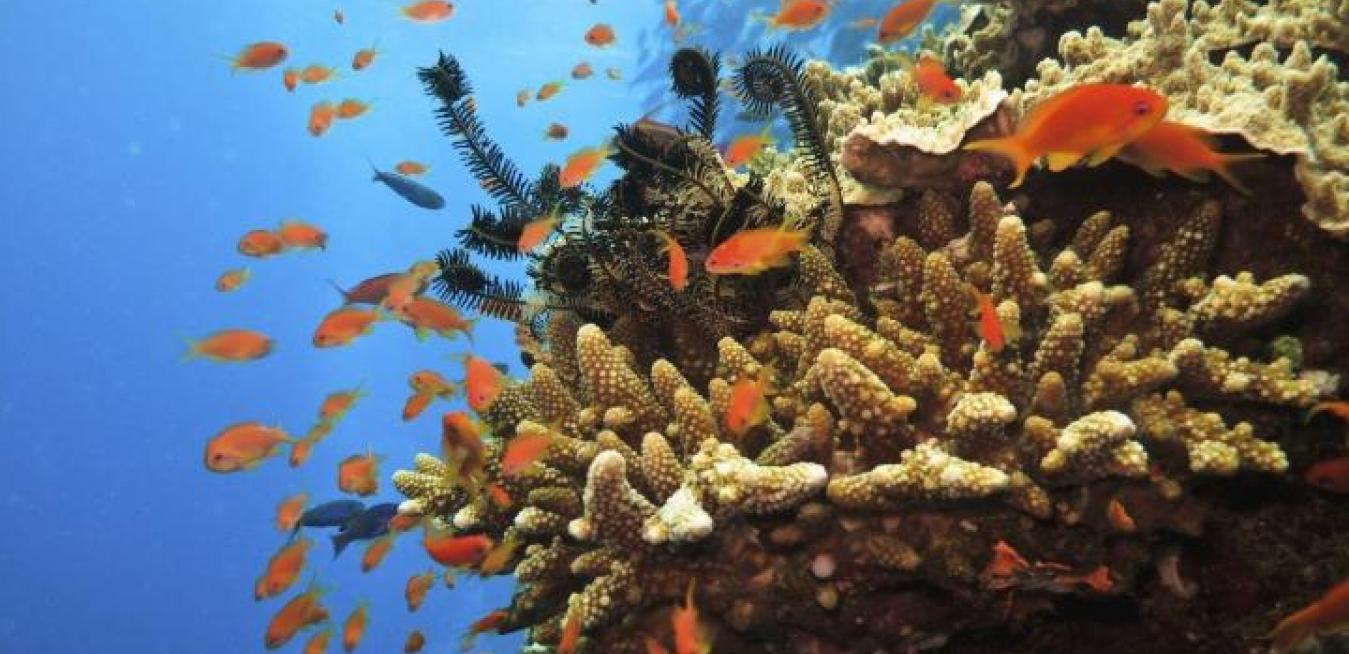
Climate change, shipping, coastal development, farming and fishing are among the modern pressures on the 35-million hectare Reef, and better and more accessible data will help all the players understand their impacts. The environmental and economic importance of the project is well illustrated by the list of eReefs partners: The Great Barrier Reef Foundation, the Bureau of Meteorology (BoM), CSIRO, the Australian Institute of Marine Science and the Queensland Government are collaborating with funding support from the State and Federal governments and the private sector, including BHP Billiton and the BHP Billiton Mitsubishi Alliance.
The Dashboard comprises daily satellite imagery cross-referenced with historical data and brought to life as an accessible tool by multiple complex algorithms.
“Over a series of years, CSIRO has collected a range of measurements across the Great Barrier Reef and developed an artificial neural network that’s trained to recognise different colours of the water,” says Greg Stuart, manager of coastal information services at the BoM. “After doing a whole bunch of pretty technical equations, you can get the concentration of sediments in the water, or the amount of chlorophyll, which is an indication of how productive the water body is, or how much runoff from farms might have impacted on the water across the Great Barrier Reef.” The space-eye view affords a daily picture of the entire Reef, which simply isn’t possible via physical water sampling, even though collection of that data will continue and feed into the Marine Water Quality Dashboard and other eReefs tools.
As a scientist, Robillot stresses that the Dashboard is “one of the multiple pieces of the puzzle that people need to assemble to get the right answers. The satellite gives you the reflectance information—but provides limited information with regard to water quality and biological processes happening further down in the water column.”
Robillot isn’t dissing his Dashboard; he’s explaining how he and the eReefs team make sure the best scientific information is available to support decision makers. “In order to overcome the inherent limitations of in situ monitoring in such a large area, we model the system in real time,” he says. “You need to model the way the water moves, its temperature and its salinity but you also need to understand how contaminants are transported and transformed from the catchment into this environment. When you understand the water circulation and the processes within the water column, you can then consider inputs from the catchments and say, ‘Let’s say this river discharges that many tonnes of sediments during a flooding event, what will happen to this sediment? Where will the particles go? Where will they settle? How will this impact the amount of light available to corals?’ And so on and so forth.
Just the fact of publishing this information every day will change the way that you think about the environment and how you interact with it.
Unsurprisingly, the Great Barrier Reef Marine Park Authority and the Queensland Government have been the biggest users of the Dashboard to date. A key element is the production of annual report cards, monitoring and modelling a variety of water-quality data within the Reef and the paddocks, rivers and catchment systems upstream. The Dashboard has automated the daily collection and management of a lot of the data that goes into the report cards, says Stuart. “As the satellite goes over, we collect the images, do the analysis, update it, put it into the Dashboard and publish it,” he explains. “You can download it directly from the website—if you’re a very technical user who knows how to deal with those type of data formats, you can access it on demand and use it straight away!”
Farmers and industry will be able to use the Dashboard to better understand the potential impact of their activities to help them minimise such impact on the Reef. The help them plan their activities to minimise impact on the Reef. “If you combine your weekly forecasts with our seasonal outlooks … you can start to plan out your fertiliser applications or your stock management,” says Stuart. The Dashboard is one or two iterations away from offering real-time utility to a tourist operator, says Stuart, but early adopters can start playing around with it now to get an understanding of what the satellite imagery is showing them. “The daily forecast could be really useful to a tourist operator taking people out diving. If you know that the water quality at a particular site is going to be a bit murky then don’t waste your time going to that site, move to another one. You can modify your actions, which might help from an environmental perspective or help you to run your business more efficiently—or both.”
Again, the Dashboard is only one component of the eReefs project, with its own limitations, for example the fact that satellites cannot see through clouds. eReefs intends to provide additional tools to deliver a range of possible applications, including for fisheries and search and rescue or recovery operations after an incident. “The models we’re developing can be really useful to support response strategies in the case of a ship grounding and potential oil or chemical spills, or any other event which requires real time understanding and forecasting of currents and circulation,” says Robillot.
While the Dashboard is a small component of eReefs, it is significant because it’s currently the public face of the project, explains Robillot. Showing to a wider audience the direct links between human activities and water quality on the Reef helps the various governments to explain why they are investing so heavily to control nutrients and sediment inputs from the catchments.
The daily forecast could be really useful to a tourist operator taking people out diving. If you know that the water quality at a particular site is going to be a bit murky then don’t waste your time going to that site.
Stuart is excited by the public accessibility of it all. He recalls that when the BoM started using radar to show weather patterns and the public could go online to see where rainfall was developing, it changed the way people thought about their environment. “Just the fact of publishing this information every day will change the way that you think about the environment and how you interact with it,” says Stuart. “Publishing the current condition of a particular part of the reef helps people to have confidence in how the authorities are managing that area.”
Over the next few years, eReefs will release a series of products to increase even further our capacity to understand, measure and predict the condition of water quality on the Great Barrier Reef.
Read more about how GE Water’s ZeeWeed is at work to help improve the water quality of the Great Barrier Reef, with water filtration plants in Townsville and Cairns using the membrane technology.