Dashboards
About Dashboards
Dashboards are stored in the Catalog, and they are displayed on the Dashboard page. The content of each dashboard is determined by queries that define what should be displayed on the dashboard. Throughout this documentation, we use the term dashboard to refer to the dashboard Catalog item and its underlying queries that are displayed on the Dashboard page.
Dashboard Catalog items store configurable widgets. The term widget is used in the Predix Essentials documentation to refer to dashboard widgets, their configuration options, and default layouts.
Predix Essentials includes a set of baseline dashboards that are specific to certain modules and work processes. If you do not specify a default dashboard in Predix Essentials, the APM Foundation dashboard will be set as your default dashboard.
About Filtering Dashboard Content
The dashboard content that is displayed in query, calendar, and graph widgets can be filtered according to the criteria defined in the query selected in the Filter Query section of the dashboard edit view. This query defines the content of the Enter Parameter Values window that appears when you open a dashboard.
The filter parameter values can be defined in the URL that you use to access the dashboard. If you do not specify the parameters in the URL, the default values specified in the underlying query, or your previously used values, which are stored as a user preference are used.
About Filter Parameter Value Precedence
- When you access the dashboard using a URL that specifies filter parameter values, the specified values are always used. For example, when you access the URL #dashboard/64252603546?asset=345728389&days=90, the dashboard with key 64252603546 is opened and the filter parameter values are set to asset=345728389 and days=90. Note: After you access the dashboard using a URL that specifies filter parameter values, you can still modify the filter parameter values. However, if you refresh your browser, the filter parameter values will revert to the values specified in the URL.
- When you access the dashboard using a URL which does not specify filter parameters, or you access a dashboard from the Dashboard page:
- Your stored user preferences are used. For example, when you access the URL #qdetail/64252603546, the query opens in the results-only view and your stored user preferences are used to set the parameter values.
- If you do not have stored user preferences, the default parameter values specified in the underlying queries are used.
- If default parameter values are not specified in the underlying queries:
- For Asset Hierarchy parameters, the global asset context, that is, the asset or asset group currently selected in the Assets page, is used.
- For other parameters, the Enter Parameter Values window appears. Enter the values you want to use and select Done to set the parameter values.
Access and Modify the Dashboard Configuration
Procedure
- In the upper-right corner of the page, select Edit Mode.
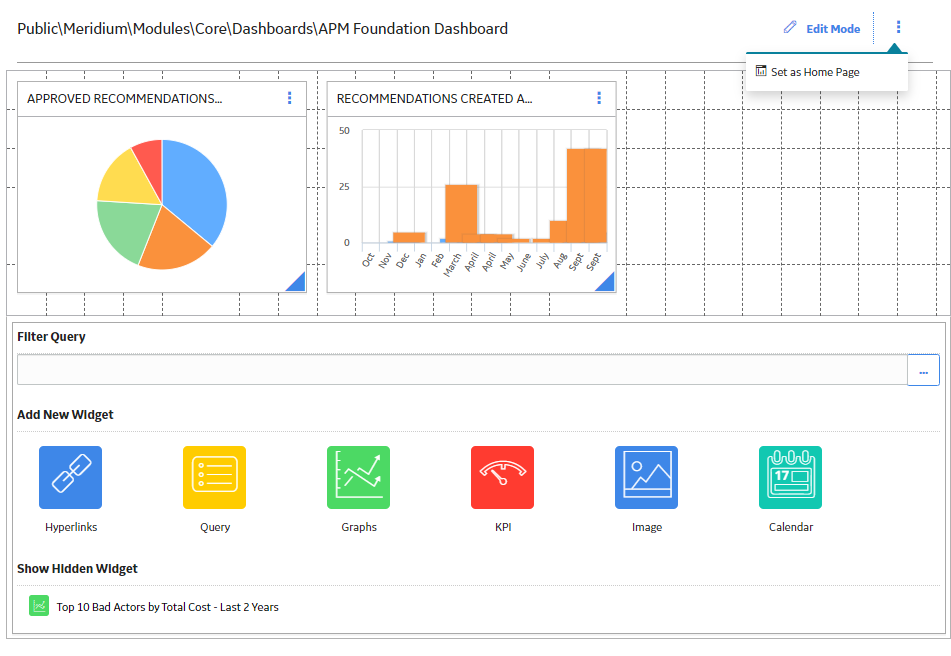
Depending on your security permissions, the following options appear:
-
In the upper-right corner of each widget, select
 to display the following menu options:
- Edit: Displays the Edit Widget window for the dashboard.
- Hide: Hides the widget from the dashboard.
- Remove: Deletes the widget from the dashboard.
- Filter Query : Displays a window with prompts by which to filter query results.
- Add New Widget : Displays buttons for each widget type.
- Show Hidden Widgets : Displays a list of widgets that are hidden from the dashboard. This list is displayed to all users. You can redisplay a widget that appears in this list.
Tip: You can move widgets by selecting them and then dragging-and-dropping them in your desired location. You can also resize widgets by selecting the border of the widget and adjusting its dimensions. You can also configure responsive layouts to support devices with different screen sizes -
Create a New Dashboard
Procedure
Configure The Responsive Dashboard Layout
About This Task
| Device | Supported screen width | Layout grid columns | Minimum widget size |
|---|---|---|---|
| Phone | Up to 600 pixels wide | 4 | 4 columns x 4 rows |
| Small Tablet | Between 600 and 767 pixels wide | 8 | 6 columns x 4 rows |
| Tablet | Between 768 and 1023 pixels wide | 12 | 6 columns x 4 rows |
| Desktop screen | Between 1024 and 1799 pixels wide | 24 | 6 columns x 4 rows |
| HD screen | More than 1800 pixels wide | 24 | 6 columns x 4 rows |
Procedure
Filter Dashboard Content
Procedure
- In the Filter Query section, select
 .
.The Select a query from the catalog window appears.
- In the upper-left corner of the page, select
 .If the does not appear on the upper-left corner of the page, then, in the upper-right corner of the page, select Edit Mode, and then select Edit Mode again. This will cause the button to appear.The Enter Parameter Values window appears.
 - Using the options on the window, configure values by which to filter the query results, and then select Done.The dashboard content is filtered according to the selected parameters.Note: You can select
 (Open in New Tab) icon to open the selected query in the Design workspace.
Set a Dashboard as the Home Dashboard
About This Task
 from the top navigation bar. You can set any existing dashboard as your home page.
Procedure
- Select , and then select Set as Home Page.The Set as Home Page window appears.