Cost Benefit Analysis Report for Enterprises
About the Cost Benefit Analysis Report for an Enterprise
The Cost Benefit Analysis Report for an enterprise enables you to analyze the cost avoided by resolving the cases that were created for the assets in the enterprise. This includes the cases that were resolved for the sites and blocks within the enterprise. You can specify the period for which you want to view the report in the header section of the page. The report provides the following information for the specified period:
- The total number of cases created for the enterprise and the total cost saved by resolving these cases.
- The avoided cost based on the sites, cases, and closure code of cases.
- Breakdown of the avoided cost for each case.
- List of all the cases that were resolved for the enterprise, along with links to access the details of the cases.
- List of the five highest cost saving cases of the enterprise.
The information in the report is presented using graphical elements such as charts and tables. This makes it convenient to analyze the information. The report is divided into the following sections to segregate the information for better analysis:
All monetary values in the report are displayed in the currency configured for the enterprise and it appears in the Currency field in all the three sections of the report.
For information on accessing the Cost Benefit Analysis Report for an enterprise, refer to the Access the Cost Benefit Analysis Report topic.
The following image shows an example of the Cost Benefit Analysis Report for an enterprise:
Note: You can filter the cases based on the closure date. When you enter a date in the Case Closed date field, all the cases that were closed in that selected date range, will be listed in the CBA analysis report.
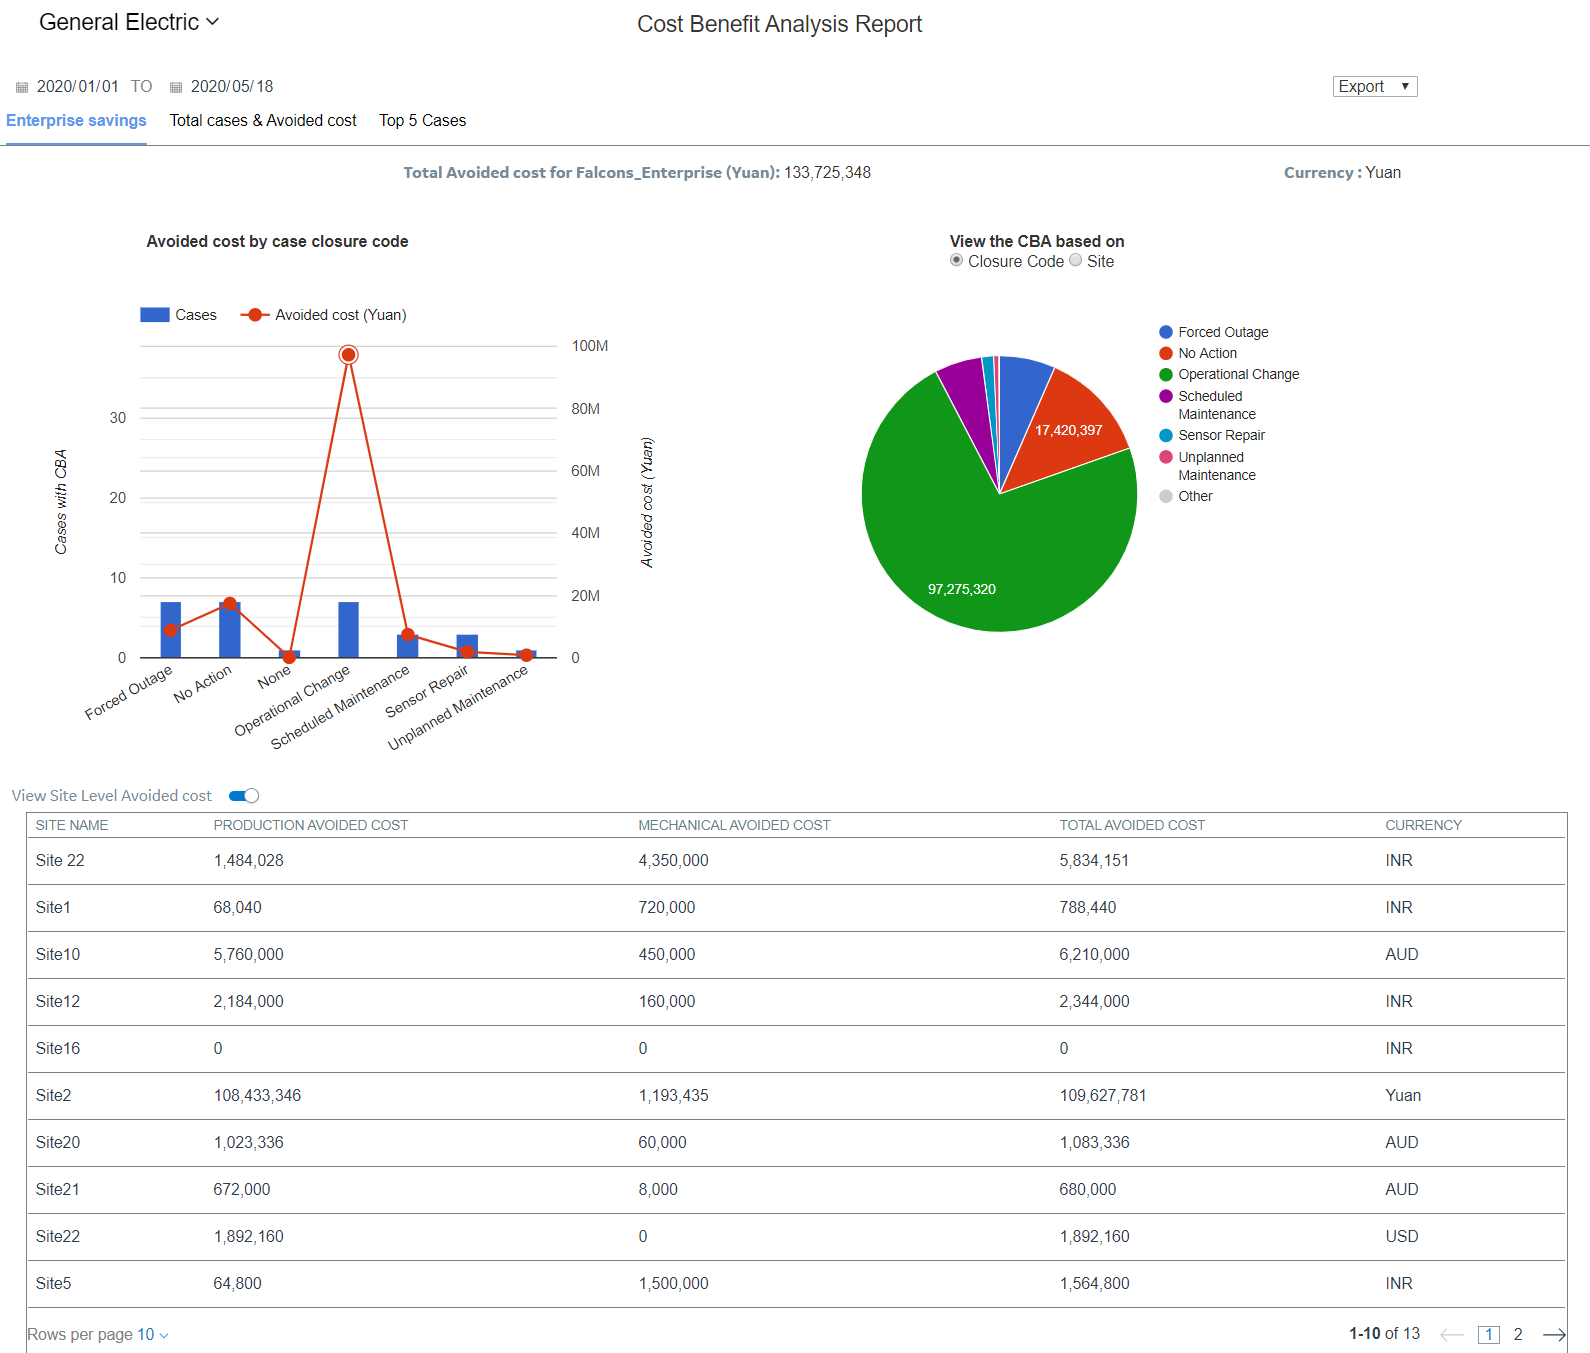
About the Enterprise Savings Section
The Enterprise Savings section in the Cost Benefit Analysis Report for an enterprise contains the following:
- Total cost avoided for the enterprise
- This information appears in the appears in the Total Avoided cost for <Enterprise Name> (<Currency>) field at the top of the Enterprise Savings section.
- Bar chart displaying avoided cost based on case closure codes
- The bar chart appears in the Avoided cost by case closure code section. This chart provides a graphical comparison between the number of cases and avoided cost for each case closure code.
- Pie chart displaying Cost Benefit Analyses of cases
- The pie chart appears in the View the CBA based on section. This chart provides a visual comparison between the proportions of cost avoided for each case closure code and site. By default, the pie chart displays the Cost Benefit Analysis data based on the case closure codes. However, you can select Site to view the data based on the sites.
- Table containing breakdown of cost saved in each site
- This table appears at the bottom of the Enterprise Savings section and contains a breakdown of the cost that was saved at each site of the enterprise. You can switch the Site Level Avoided cost toggle to hide the table. The table contains the following columns:
- SITE NAME
- PRODUCTION AVOIDED COST
- MECHANICAL AVOIDED COST
- TOTAL AVOIDED COST
- CURRENCY
About the Total Cases & Avoided Cost Section
The Total cases & Avoided cost section in the Cost Benefit Analysis Report for an enterprise contains the following:
- Total avoided cost by the enterprise
- This information appears in the Total Avoided cost for <Enterprise Name> (<Currency>) field at the top of the Total cases & Avoided cost section.
- Table containing details and cost breakdown of all cases resolved for the enterprise
- This table contains the case IDs, description, and closure code of all the cases that were resolved for the enterprise. Additionally, the table contains the breakdowns of the cost that was saved by resolving the cases, along with links to view the details of each case. The table contains the following columns:
- CASE ID
- CASE DESCRIPTION
- CLOSURE CODE
- PRODUCTION AVOIDED COST
- MECHANICAL AVOIDED COST
- TOTAL AVOIDED COST
About the Top 5 Cases Section
The Top 5 Cases section in the Cost Benefit Analysis Report for an enterprise contains the following:
- Total cost avoided for the enterprise
- This information appears in the Total Avoided cost for <Enterprise Name> (<Currency>) field at the top of the Top 5 Cases section.
- Table containing details and cost breakdown of the five highest cost saving cases
- This table contains the case IDs, description, and closure code of all the five highest cost saving cases that were resolved for the enterprise. Additionally, the table contains the breakdowns of the cost that was saved by resolving the cases, along with links to view the details of each case. The table contains the following columns:
- CASE ID
- CASE DESCRIPTION
- CLOSURE CODE
- PRODUCTION AVOIDED COST
- MECHANICAL AVOIDED COST
- TOTAL AVOIDED COST