About OPM
About the Operations Performance Management Solution
Operations Performance Management (OPM) is a complete control-to-cloud optimization solution. Using OPM, you can optimize the performance and throughput of your plants, sites, and portfolio by stabilizing your operation and optimizing yield, quality, and efficiency. You can thus increase the revenue and margin of the organization.
- OPM provides a cloud-based distributed computation framework to define and run key performance indicator (KPI) calculations. The framework provides services and applications to build different types of KPIs to serve purposes such as tracking and analyzing manufacturing processes, or monitoring the health of industrial assets.
- It supports operational decision-making so that you can rapidly respond to changing conditions. It provides accurate, clear, and complete situational awareness to help you maximize outcomes.
- It provides access to critical production and operations data anytime and anywhere.
- You can deploy OPM on-premises and in the could on GE's Predix platform. Predix enables industrial-scale analytics and brings the right data to bear, at the right time, to drive better operating decisions.
Using Operations Performance Management (OPM), you can build web-based analytics dashboards with reusable KPI charts and templates.
The framework provides services that can be extended to perform the following tasks:
- Support multiple tenants instances and manage them separately.
- Create analytic computation artifacts to upload to the APM common analytic framework's catalog.
- Build the analytic template.
- Create analytic deployments.
- Deploy KPI jobs to run on one or many assets and run jobs in Spark runtime.
- Batch load data and run analytics.
- Stream data for generating KPIs in near real-time.
- Generate forecasted data using the forecast widget services and app.
- Audit and log KPI catalog management activities for adherence to compliance requirements. The audit logs provide a chronological record of user activities associated with creating, updating, and deleting KPI templates and with deployment and scheduling KPIs within KPI Management.
When to Use OPM Cloud
There are certain scenarios where OPM Cloud based analytics are particularly recommended.
The three main optimization focus areas of the framework are as follows.
Operational Intelligence
Operational intelligence is to proactively respond to business KPIs and enable centralized benchmarking for increased efficiency. The following are examples of possible applications in this area:
- Throughput and Margin KPIs - Accelerate time to value for Plant Managers and Process Engineers through a KPI catalog giving complex performance and financial KPI calculations including revenue, process efficiency, and process performance.
- Benchmarking - Compare KPIs between multiple sites and the ability to drill-down on contributing factors.
- Audit Logs - Provide audit functionality to track user interactions with system (who, what, when) and changes. The audit logs provide a chronological record of user activities associated with creating, updating, and deleting KPI templates and with deployment and scheduling KPIs within KPI Management.
Forecast
Scenario analysis and planning to ensure confidence to execute best business outcome. The following are examples of possible applications in this area:
- Forecasting - Provide forecasted outcomes (e.g. power output and efficiency calculations) so that managers can evaluate future output against targets and take action to further optimize.
Optimization
Optimize processes and people balancing revenue, costs, and emissions for sites and fleet. The following are examples of possible applications in this area:
- Emissions Optimization - Utilize emissions constraints to ensure that recommended optimized operations do not violate the emissions limits.
- Financial Optimization - Define financial goals (revenue vs. profit) to drive the optimization calculations. Ensure plant operations achieve financial goals.
- Schedule Optimization - Match tasks, tools, and people to ensure an optimized work schedule achieves maximum output.
- Process Optimization - Run the optimization routines on-site and coordinate with the cloud to ensure the models utilized are the latest.
Architecture and Components
The following product architecture shows the components of the framework and its dataflow:
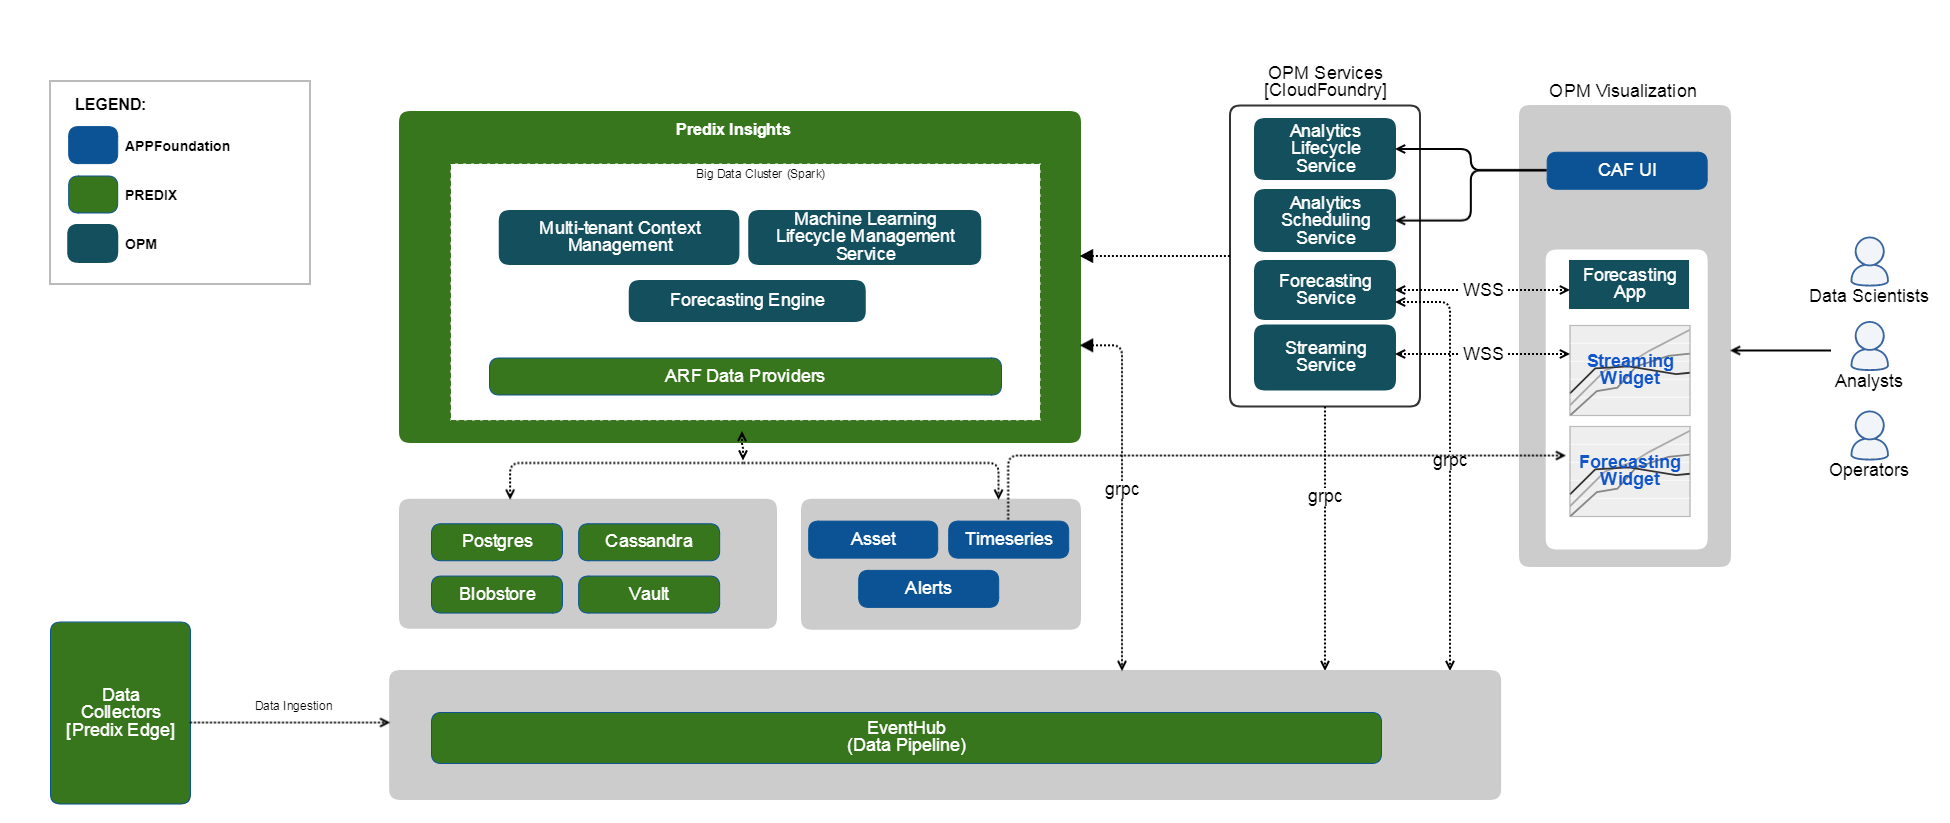
- OPM UI Widgets and Apps
- The suite of visualization apps that enable you to plot the output tags that the deployed analytic generates. OPM widgets are available in the APM widget library for access to a configured OPM tenant. These widgets are not available as part of the core APM widget library.
- OPM Services
- A suite of services that provide the ability to define your analytic, add and manage them in the catalog, create and deploy jobs for analytic, and run deployed jobs.
- OPM Runtime
- The environment for running the deployed analytic jobs. The runtime also houses the forecasting and prediction engines. Apache Spark cluster is the default deployment and runtime environment for the deploying the created analytic.
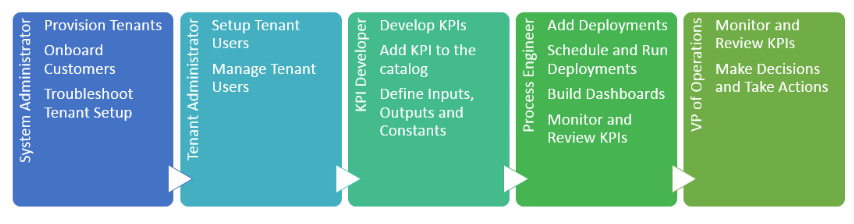
Operations Performance Management User Workflow
The following diagram provides a workflow overview for the Operations Performance Management users in the system.
Documentation Scope
The documentation in the Manage OPM section covers the concepts and tasks related to the following persona- KPI developers, process engineers, and VP of operations. The system administrator and tenant administrator tasks are not covered here.
OPM Users
The following users may directly or indirectly interact with OPM framework and features:
System Administrator
System administrators need to create customer tenancy and connect their data sources to OPM. They also train customers on how to add their own analytics to the catalog. System administrators use the framework to perform the following tasks
- Provision tenants for customers.
- Set up new customers.
- Provide customer support for using OPM.
Tenant Administrator
Tenanat administrators manage users within a tenant. They can perform the following tasks:
- Set up users within a tenant.
- Manage users within a tenant.
- Manage access to assets and features for users within a tenant.
Analytics Developers and Data Scientists
These users employ historical data to study data patterns, draw insights and identify both asset and non-asset key performance indicators relevant to their industry needs. They have granular knowledge of data and data statistics, and use programming languages such as Java and Python to develop the analytic templates and deployment jobs. They use the framework to perform the following tasks:
- Build the analytic's computation logic.
- Test and validate the analytics.
- Add analytics to the catalog.
- Create analytic template definitions.
Process Engineer
Process engineers monitor and analyze current processes to identify areas for improvement. They work closely with data scientists and analytic developers to define and test algorithm efficacy. Technically competent, they are also familiar with analytic users. Process engineers proactively monitor analytic ouputs to identify early risks and anomalies. They use the framework to perform the following tasks:
- Add analytic deployments.
- Schedule and run analytic deployments for published analytics.
- Build context-aware, industry-specific dashboards (contextual dashboard).
- Configure dashboards with existing analytic ouputs from the catalog.
- Monitor and review analytic ouputs.
- Report targets and risks based on KPIs.
VP of Operations
Operations executives can use customized analytics dashboards to perform the following actions:
- Monitor and review analytics at organization or group level. For example, a plant manager may be interested in viewing the yield of a product.
- Make decisions and take required actions.