The goal of all companies is to lower risk, reduce expenses, and produce a quality product at a predictable rate and cost while maintaining reliability. While owners and managers know the maximum amount they can produce during optimal operating and financial conditions, most companies rarely produce this amount on a regular basis. Inevitably, unplanned events occur that cause them to produce less than the desired amount. For example, a machine might stop working, causing workers to stop production while they wait for the machine to be repaired. In other cases, planned events cause production to slow down or stop. For example, planned shutdowns and predictable decreases in demand based on historical patterns can lead to production losses.
As a result of decreased production, companies incur costs and are unable to earn maximum profit.
Meridium APM Production Loss Accounting (PLA) allows you to:
Enter production data.
Identify production losses and associate them with the events that caused them.
Determine what types or categories of events cause your company to lose the most production.
By entering and evaluating production data, you can more easily identify ways in which you can reduce unplanned downtime and increase production in the future, which will result in reduced cost and increased profit.
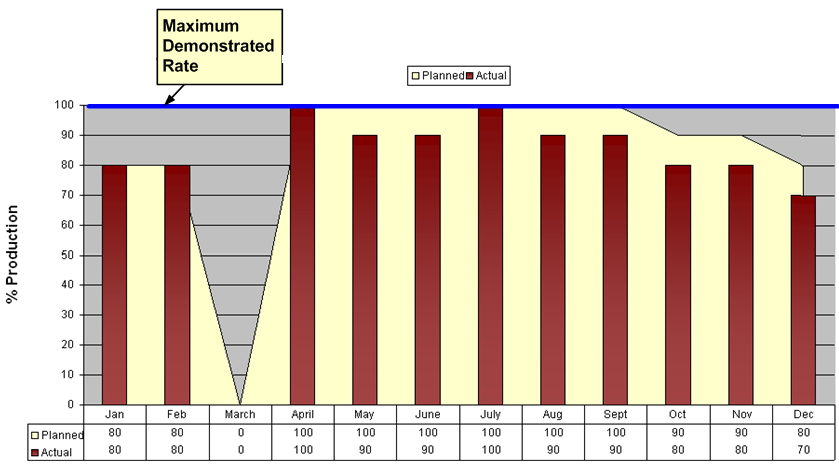
Consider the following graph, which represents a company's optimal, planned, and actual production percentage for a year.
In this graph, you can see from the blue line that the maximum demonstrate rate, or the percentage of output the company can produce during optimal operating conditions, is 100%.
The yellow area displays the planned production percentage for each month. Because the managers know that they cannot produce 100% of this maximum output each month, the planned production rate is lower than 100% during some months. In March, the planned production rate is 0% because the company plans to shut down that month to perform maintenance, install new equipment, and so on.
The red bars indicate the actual production rate each month. You can see that in some months, the company produced the amount they planned, and in other months, they produced less than they had planned.
From this graph, managers might conclude that more than half of their lost production for the year was due to the shutdown in March. If they could find a way to reduce this shutdown time or eliminate it completely, they would see a great increase in overall production.
Based on other data entered using PLA, managers would also be able to determine exactly how much money they lost during the March shutdown and how much money they lost during other months in which they did not reach the 100% production rate. They could then categorize these losses into planned and unplanned losses.
Copyright © 2017 General Electric Company. All rights reserved.