Overview
Overview of the Generation Availability Analysis Wind (GAA Wind) Module
In North America, utility companies that own one or more wind plants report their wind performance and sub group data to the North American Electric Reliability Corporation (NERC) using the Generating Availability Data System (GADS) Wind Reporting application. The Generation Availability Analysis Wind (GAA Wind) module uses the International Electrotechnical Commission (IEC) event data from the GE Renewables Digital Wind Farm suite to help you record generation and loss data for each wind plant in your fleet.
Using GAA Wind, you can view and modify event data to create Performance Records pertaining to the overall wind turbine operation for a given period. You can then generate reports that follow the GADS mandatory reporting requirements and submit those reports to NERC.
Access the GAA Wind Overview Page
Procedure
- In the main navigation bar, select
 .
.The Asset Hierarchy appears.
- Select the asset for which you want to access the GAA Wind Overview page.
The workspace for the selected asset appears.
- Select the Reliability tab.
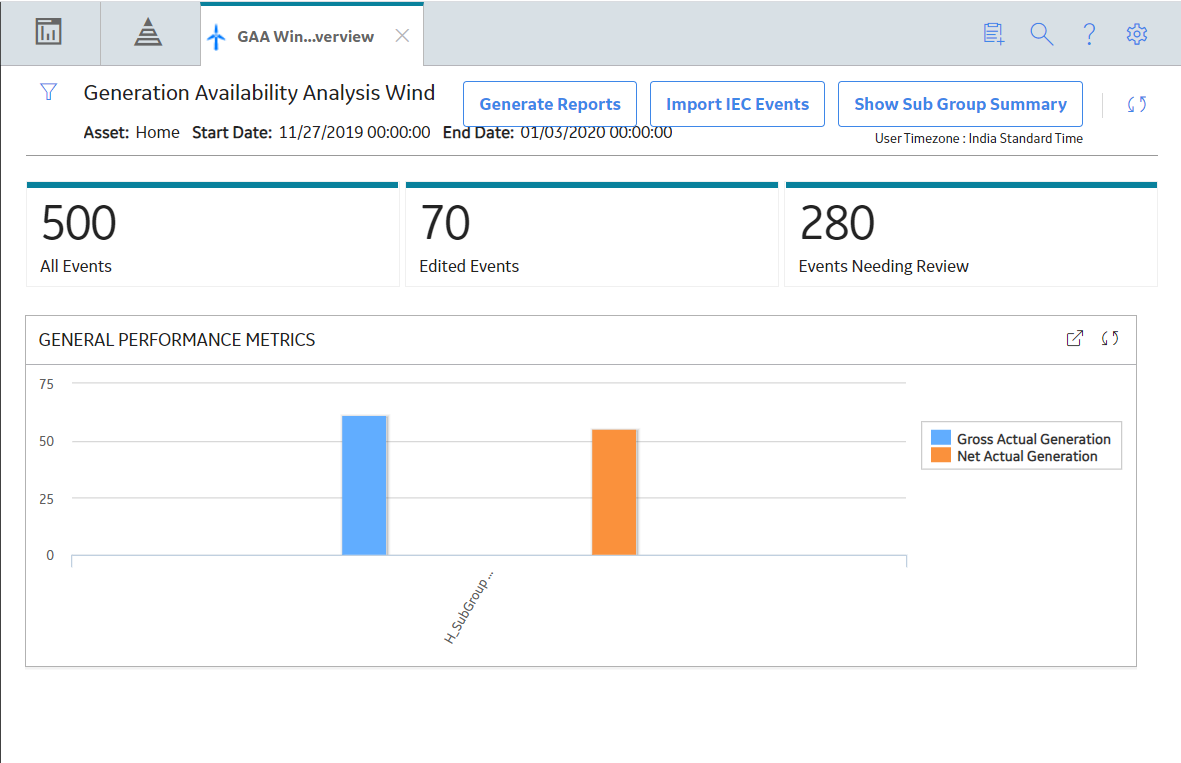
In the Generation Availability Analysis Wind row, the counts of all Events and edited Events appear as a link. These Events are associated with the selected asset hierarchy level for the last month.
- Select the link.
- All Events: Contains a table of all Events based on the asset filter (that is, Asset, Start Date, and End Date). The table contains the following columns:
- UNIT NAME: Contains the Unit associated with the Event.
- SUB GROUP NAME: Contains the Sub Group associated with the Event.
- IEC STATE: Contains the IEC type of the Event.Note: If the value in the IEC Event Type field of the Event is IU,
 appears next to the value in this column.
 - START DATE: Contains the date and time when the Event began.
- END DATE: Contains the date and time when the Event ended.
- DURATION: Contains the duration of the Event which is displayed in hh:mm:ss format.
- DESCRIPTION: Contains the description of the Event.
- NERC STATE: Contains the NERC type of the Event.
- ERROR CODE Contains the error code of the Event.Note: If the Event has an error, appears next to the value in this column.
- ACTUAL PRODUCTION: Contains the production value for the Event.
- EDITED: Contains check boxes to indicate if the Event has been edited.Note: An Event is considered to be edited if any of the field value has been modified or the Event was created by splitting another Event. A cleared check box in this column indicates that the Event has not been edited, whereas a selected check box indicates that the Event has been edited.
- Edited Events: Contains a table of Events whose field values have been modified or the Event was created by splitting another Event. These Events are based on the asset filter. With the exception of the Edited column, the columns that appear in the All Events section also appear in this section.
- Events Needing Review: Contains a table of Events whose value in the NERC Type field is blank or contains values other than CTH and RUTH. These Events are based on the asset filter. All the columns that appear in the All Events section also appear in this section.
- GENERAL PERFORMANCE METRICS: Contains a bar chart that represents the distribution of the generation values (that is, gross actual generation and net actual generation) for Sub Groups. The category (x) axis represents Sub Groups for which Performance Records have been created; these Sub Groups are categorized based on their generation values. The value (y) axis represents the values in the Gross Actual Generation and Net Actual Generation fields of the Performance Records for a given Sub Group, month, and year.
This bar chart is based only on the asset information of the asset filter.
Note: To access the detailed graph result, select .
.
- Using
 , you can filter the Events based on the following information:
- Asset: Indicates the asset hierarchy level.
- Start Date: Indicates the start date and time of the period.
- End Date: Indicates the end date and time of the period.
- The time stamps of the Events are stored in Coordinated Universal Time (UTC). Therefore, if your time zone is different from UTC, to access all the Events for a given period, you may need to modify the values in the START DATE and END DATE boxes such that their UTC equivalents account for the entire period.
- The logged in User timezone is displayed in the Header section.
- The event data retrieved includes the following spanning events as well.
- If the start time stamp of an Event is earlier than the value specified in the START DATE box in the Asset Filter window.
- If the end time stamp of an Event is later than the value specified in the END DATE box in the Asset Filter window.
The Generation Availability Analysis Wind overview page is not updated automatically when you return to the previously opened tab. You can select  to update the page.
GAA Wind Workflow
About This Task
This workflow provides the basic, high-level steps for using GAA Wind. The steps and links provided in the workflow do not necessarily reference every possible procedure.
Procedure
- Import Events for the required Company and Sub Group from the GE Renewables Digital Wind Farm suite.
- As needed, modify, create, or split Events for the Sub Group.
- Create a Performance Record for the Sub Group.
- Generate a Performance Report for the Sub Group.
- Generate a Sub Group Report for the Sub Group.