Overview
Overview of the Root Cause Analysis (RCA) Module
The GE Digital APM Root Cause Analysis (RCA) module lets you conduct a root cause analysis, which allows you to analyze causes of failures. A root cause analysis also allows you to track the performance of the equipment by following implementation of recommendations. When you create a Root Cause analysis, you are using GE Digital APM tools to facilitate a standard process that is based on the PROACT® for Meridium methodology.
More Details
A root cause analysis is the process of analyzing failures down to their root causes, which can include but is not limited to physical causes, human causes, and latent causes of the failure.
In the GE Digital APM system, elements of a Root Cause analysis store all the information necessary for the team to identify a root cause for failure of and asset.
When the Root Cause analysis is complete, it can be published and made available to users who are not members of the analysis team, allowing them to view the results using GE Digital APM tools.
When a failure occurs in your facility, there could be any number of causes that led to the failure. If you investigate the causes, you might find that each failure is caused by another higher-level cause. If this root cause remains unidentified, the failures will likely persist.
For instance, consider an example of a car that has had trouble starting every month for the past three months. In this case, you might determine that:
- In the first month, the cold weather caused the failure.
- In the second month, the battery was low.
- In the third month, the warning to check engine was displayed in the dashboard.
If you were to conduct a root cause analysis on the car, you may find that while each month's failure had its own apparent cause, the root cause of each failure was that a voltage regulator was malfunctioning.
To help you identify the root causes of failures in your facility, you can assemble an RCA Team that will:
- Collect data relevant to the failure.
- Analyze the data.
- Develop hypotheses about the root cause.
- Develop recommendations for preventing the failure from occurring or lessen the impact of the failure in the future.
- Implement recommended solutions.
- Track implemented solutions and re-evaluate them, as needed.
Access the RCA Overview Page
About This Task
This topic describes how to access the RCA Overview page on which you can view all the information and perform various tasks related to Root Cause Analyses for various Asset Hierarchy Levels.
You can perform various tasks on this page based on the Security Groups to which you are assigned.
Procedure
The RCA Overview page appears.
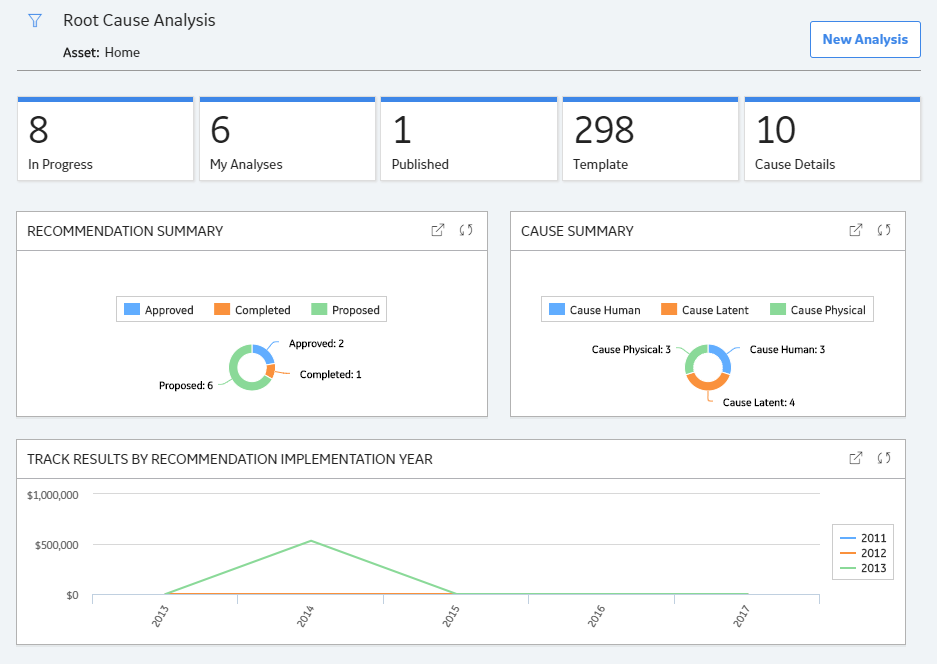
The tabs at the top of the page summarize the number of items in each category. You can select a tab to view one of the following lists:
- In Progress : Displays Root Cause Analyses that have not yet been completed.
- My Analyses : Displays Root Cause Analyses to which you are assigned as a team member.
- Published : Displays Root Cause Analyses that have been completed and published.
- Template : Displays Root Cause Analyses that you can use to create new Root Cause Analyses. The Root Cause Analyses in the Template state are identical to Root Cause Analyses that are in the In Progress state, except that they do not have an analysis team defined.
- Cause Details : Displays Root Cause Analyses that have their cause type defined in the Logic Tree. You can select the hyperlink for an analysis to view the details of the Root Cause Analysis. The Root Cause Analyses in the Template state are not included.
On the page, you can also view the following sections:
- Recommendation Summary graph: Displays the number of recommendations in each state.
-
Cause Summary graph: Displays the number of Hypotheses, for the selected Asset Hierarchy Level and its children, that are related to each type of cause (i.e., Physical, Human, and Latent). The Root Cause Analyses in the Template state are not included.
-
Track Results by Recommendation Implementation Year graph: Displays yearly performance of Asset Hierarchy levels on which RCA recommendations have been implemented. The chart displays sum of all the maintenance costs and production costs from the work history family associated with all the Asset Hierarchy levels related to the RCA recommendations that have been accomplished within the year. The chart plots the maintenance costs of the Asset Hierarchy levels for the current year and the previous four years.
Note: Optionally, if you have an active license for PLA and access to the required PLA families, you can change this graph to one that includes the production costs associated with Production Loss Analysis (PLA). To do so, access the dashboard configuration for the RCA Dashboard-V4 dashboard, which is stored in the Catalog folder \\Public\Meridium\Modules\Failure Elimination\Dashboards, and then modify the graph widget to reference the query \\Public\Meridium\Modules\Failure Elimination\Queries\FE Dashboard Query - Track Result - Total for Graph-V4.
While viewing any of the graphs on the RCA Overview page, you can select  to customize the appearance of the graph.
By default, the hierarchy level is set to Home. You can filter the hierarchy level by selecting  in the upper-left corner of the page. By default, the Root Cause Analysis information that will appear on the page is related to an Asset and children of the Asset.
RCA Workflow
This workflow provides the basic, high-level steps for using Root Cause Analysis. The steps and links in this workflow do not necessarily reference every possible procedure.
- Define when an RCA should be performed.
- Create a Root Cause Analysis.
- Add Critical Success Factors to an RCA.
- Select the members of the RCA team.
-
Modify the Team Charter in the Definition section.Note: The user that completes tasks listed in Step 2 to Step 6 will be added to the RCA Team automatically as the Principal Analyst. After completing these steps, you can designate a different team member as the Principal Analyst.
- Link the Assets on which the RCA is based.
- Link the RCA to Reference Documents, which contain reference material relevant to the analysis.
-
Create RCA Preserve records and assign them to team members.Note: While the PROACT acronym lists the Preserve step first, the order in which you perform the associated task in GE Digital APM can differ.
- Create an Event Diagram or a Logic Tree to provide a visual representation of the data that was collected. You can create an Event Diagram or a Logic Tree depending on your requirement. Note: Interaction with diagramming and design canvases is not available on touch-screen devices.
- Create RCA Recommendations, communicate findings, and generate reports to present the team's conclusions to the decision makers in your organization. After you have successfully communicated the team's findings and the proposed recommendations have been approved, the recommendations should then be implemented within the organization.
- Create RCA Tracking Items to track the success or failure of the solutions that were implemented.