Overview
Overview of the Generation Availability Analysis (GAA) Module
In North America, many utility companies report generation and loss event data to the North American Electric Reliability Corporation (NERC) or Canadian Electricity Association (CEA) using the Generating Availability Data System (GADS) application. The Generation Availability Analysis (GAA) module uses the core functionality of GE Digital APM to help you record generation and loss data for each unit in your company.
Using GAA, you can view and modify event and fuel consumption data to create performance records pertaining to the overall power generation for a given period. You can then generate reports that follow the GADS mandatory reporting requirements and submit those reports to NERC or CEA.
In addition to simple data collection and reporting, you can use GAA to analyze your power generation data further using other GE Digital APM modules. Examples:
- You can use Root Cause Analysis to conduct a root cause analysis on the failure of a unit to produce the required output.
- You can use eLog to create a log entry for a generation event.
- You can use Asset Health Manager to access the health indicators for an asset.
Assumptions Made in the GAA Documentation
Throughout this documentation, we assume that you are familiar with the terminology and concepts discussed in documentation released by the North American Electric Reliability Corporation (NERC) and Canadian Electricity Association (CEA).
In addition, we assume that you have not modified the baseline family- and field-level rules for the GAA families and that you are using the workflows that are described in this documentation. If you modify the baseline rules or use workflows other than those described in this documentation, the field behavior and record functionality may differ from what is described.
About Policies and R Scripts used by GAA
R scripts are used in GAA to perform calculations. The libraries available in R scripts simplify calculations in GAA. The R scripts can be used with policies to provide a graphical representation of performance information in GAA.
You can modify an R script or a policy to customize calculations or the graphical representations in GAA.
You can customize calculations in GAA using one of the following methods:
- Modify an R script.
- Create an R script and link it to the appropriate policy.
GAA Calculate Performance Policy
The GAA Calculate Performance policy is used to perform unit-related calculations in GAA. The following diagram shows the baseline GAA Calculate Performance policy:
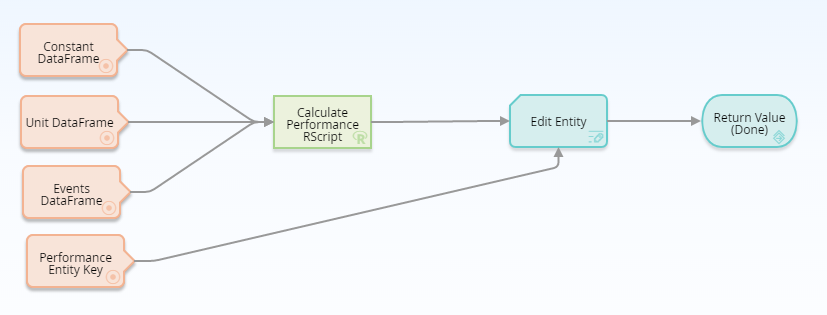
You can access the baseline GAA Calculate Performance policy and modify it based on your needs. In the existing policy, you can modify the baseline R script node (Calculate Performance RScript in the diagram) or add new nodes. You must link all existing or new nodes as input to the Edit Entity node. You must not modify the following default nodes shown in the diagram:
- Constant DataFrame
- Unit DataFrame
- Events DataFrame
- Performance Entity Key
We recommend that you do not modify the Edit Entity node in the baseline GAA Calculate Performance policy.
The following table provides the Policy and the R script used in GAA to perform various calculations. This R script is stored in the following catalog folder: Public\Meridium\Modules\Generation Management\RScripts\CalculatePerformance.
| Policy | R script Name |
|---|---|
|
GAA Calculate Performance | CalculatePerformance |
Access the GAA Overview Page
About This Task
This topic describes how to access the GAA Overview page, on which you can view all the information and perform various tasks related to Generation Availability Analysis.
By default, the information that appears on the GAA Overview page is related to all Hierarchy Levels. You can select  to filter and view the information related to either of the following based on the sites to which you are assigned:
- All the GAA Units associated to a GAA Company: When you select a GAA Company in the Asset field, information related to all the GAA Units associated with all the GAA Plants within the selected GAA Company appears on the GAA Overview page.
- All the GAA Units associated to a GAA Plant: When you select a GAA Plant in the Asset field, information related to all the GAA Units associated with the selected GAA Plant appears on the GAA Overview page.
- A GAA Unit: When you select a GAA Unit in the Asset field, information related only to the selected GAA Unit appears on the GAA Overview page.
By default, the information on the GAA Overview page is displayed for a time period between the first day of the current year and the current date. You can modify the time period by selecting , and then specifying values in the Start Date and End Date fields.
The tasks that you can perform on this page differ depending on the Security Groups with which you are associated.
Procedure
You can also access Generation Availability Analysis information associated with a functional location and its children. To do so:
-
In the upper-left corner of the top navigation bar, select
 .
.The Asset page appears.
-
In the left pane, navigate to the function location for which you want to access the GAA Overview page.
-
In the workspace, select the Reliability tab.
A list of types of performance related analyses performed on the selected functional location appears.
- Select the hyperlink for Generation Availability Analysis that specifies the number of Events Under Review, Approved Events, and Generation Reports generated for the selected functional location.
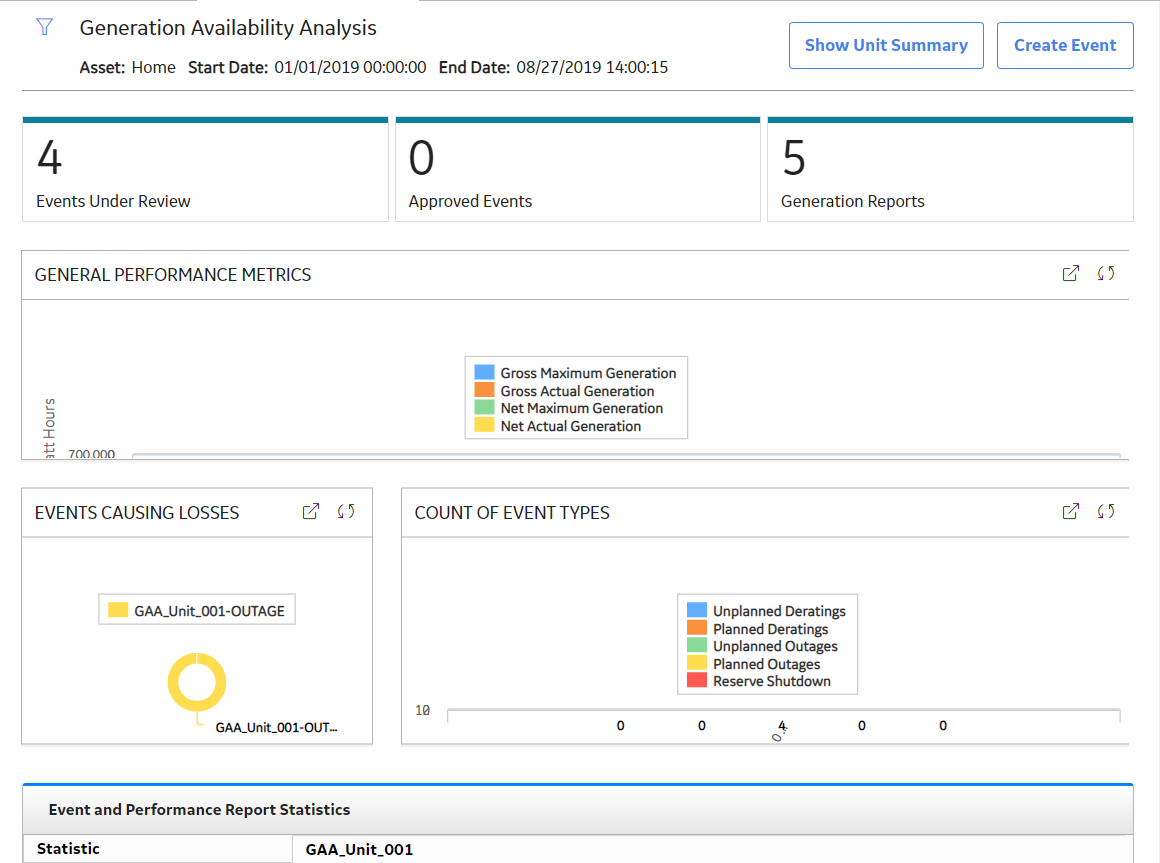
The GAA Overview page appears, displaying the following information related to each GAA Unit for the specified period:
- The Events Under Review section: Contains a list of Events that are being reviewed. The section contains the following columns of information:
- Event ID: Contains the value from the Event ID field. You can select the link in the Event ID column to access the selected event.
- Unit Name: Contains the value that you entered in Unit Name field to identify the GAA Unit to which the event occurred. You can select the link in the Unit Name column to access the Unit Summary workspace for the selected GAA Unit.
- Event Type: Contains the value that you entered in Capacity Event Type field to identify the type of event.
- Event Description: Contains the value that you entered in Capacity Event Type field to describe the event.
- Start Date: Contains the value that you entered in the Event Start field to indicate the date and time that the event started.
- End Date: Contains the value that you entered in the Event End field to indicate the date and time that the event ended.
- The Approved Events section: Contains a list of Events that have been approved. The section contains the same columns of information as the Events Under Review tab.
-
The Generation Reports section: Contains a list of regulatory and management (SSRS) reports and links to generate management reports. The section contains the following columns of information:
- Report ID: Contains the value that identifies the report.
- Unit ID: Contains the value that identifies the GAA Unit.
- Modified By: Contains the value that identifies the user who modified the reports.
- Last Modified: Contains the time when the report was last modified.
You can manage the Regulatory reports using the Manage Reports button.
- The General Performance Metrics graph section: Contains a bar graph that shows the actual and maximum productivity of each GAA Unit for the specified period. The graph plots the following fields:
- Gross Maximum Generation (MWh)
- Gross Actual Generation (MWh)
- Net Maximum Generation (MWh)
- Net Actual Generation (MWh)
The y-axis shows the number of Megawatt Hours for each GAA Unit.
When you select a bar in the graph, the Unit Summary workspace for the associated GAA Unit appears in a new tab.
-
The Events Causing Losses graph section: Contains a doughnut graph that shows the sum of losses of each of the following type for each GAA Unit for the specified period:
- Outages (MWH loss)
- Derates (MWH loss)
- Reserve Shutdown (MWH loss)
-
The Count of Event Types graph section: Contains a bar graph that shows the number of following types of events for each GAA Unit during the specified time:
- Unplanned Deratings
- Planned Deratings
- Unplanned Outages
- Planned Outages
- Reserve Shutdown
The x-axis shows the name of each GAA Unit and y-axis shows the number of events that occurred at each of the GAA Unit.
The colors that represent various fields in this graph appear based on the color that you specify when adding an Event Category. You must then modify the colors of the graph for each of the Event Categories.
When you select a bar in the graph, the Unit Summary workspace for the associated GAA Unit appears in a new tab.
-
The Event and Performance Report Statistics section: Contains a grid that displays the values from all the fields available on the Detailed Loss Net MWh tab on the Performance datasheet for each GAA Unit for the specified period.
While viewing any of the above charts, you can select  in the upper-right corner of the chart to customize the appearance of the plot by using standard graph features.
Access the Unit Summary Workspace
About This Task
The tasks that you can perform on this page differ depending on the Security Groups with which you are associated.
Procedure
- In the upper-right corner of the page, select Show Unit Summary.
The Units window appears.
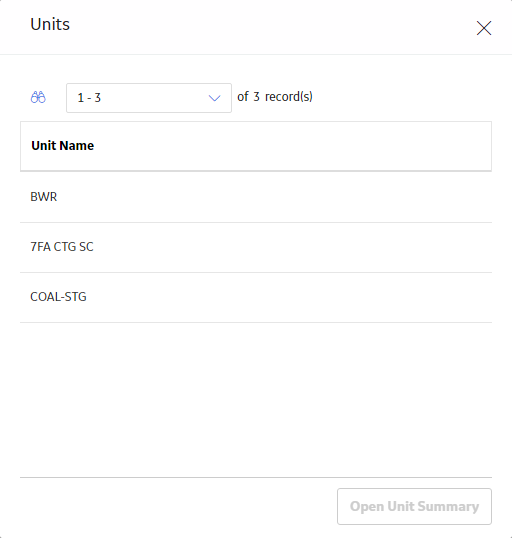 Note: The Units window appears only if there are multiple GAA Units available.
 - Select the GAA Unit whose summary you want to access, and then select Open Unit Summary.
The summary of the GAA Unit appears in the workspace. The Events Breakdown tab is selected by default. The information in the workspace is filtered based on the time period specified on the GAA Overview page. You can customize the time period by selecting
in the upper-left corner of the workspace.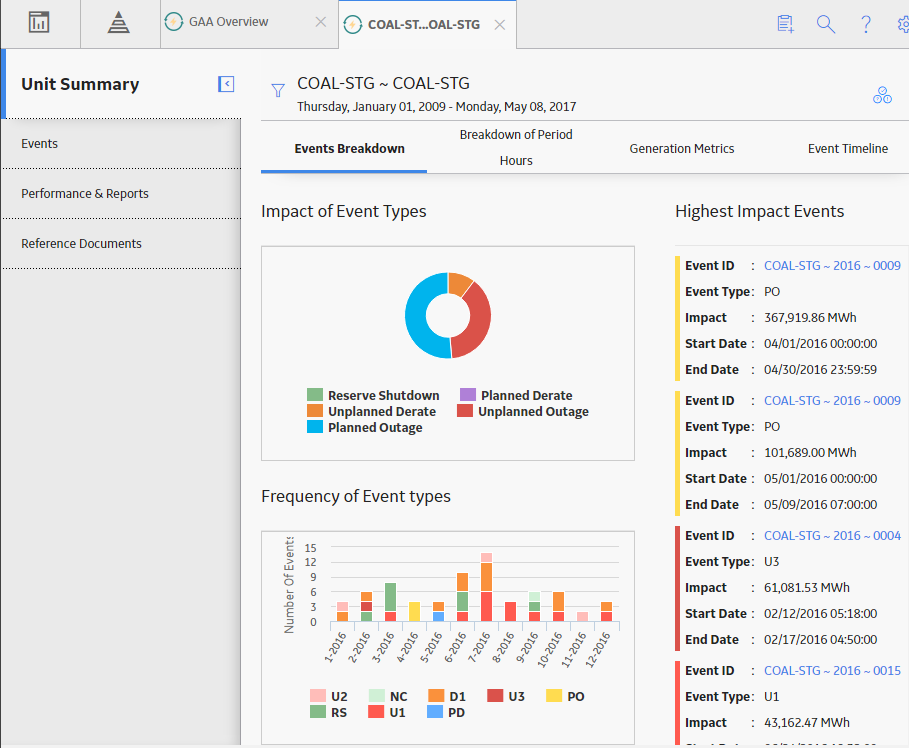
The following tabs appear in the workspace:
-
Events Breakdown : Contains the Impact of Event Types graph, Frequency of Event Types graph, and lists the Highest Impact Events information for the selected GAA Unit.
-
Breakdown of Period Hours: Contains a multi-level pie chart that shows the percentage of the Good Production, Planned Derate, Planned Outage, Reserve Shutdown, Unplanned Derate, and Unplanned Outage for the specified period for the selected GAA Unit.
- Generation Metrics : Contains a graph that shows the performance of the GAA Unit during the specified period.
-
Event Timeline: Contains a graph that shows the loss in the GAA Unit during the specified period.
You can also view the Health Summary page for an Asset if the selected GAA Unit is associated with an Asset.
The left pane contains the following tabs:
- Events: Contains a list of Primary Events associated with the selected GAA Unit.
- Performance & Reports: Contains a list of Performance records and reports associated with the selected GAA Unit for the current year.
- Reference Documents: Contains a list of Reference Documents for the selected GAA Unit.
-
About the Unit Summary Workspace
The Unit Summary workspace provides a graphical representation of the data that exists in a GAA Unit associated with a selected Primary Event.
The following tabs appear in the workspace:
-
Events Breakdown : Contains the following information for the selected GAA Unit:
- Impact of Event Types: Contains a doughnut chart that shows the type of the events that occurred during the specified time period. When you hover or click on a section of the graph, the sum of all the loss occurred due of that type of events appears.
- Frequency of Event Types: Contains a vertical bar graph that shows the number of events of each type that occurred during the specified time period.
-
Highest Impact Events: Contains a list of events that cause maximum loss during the specified time period. This section will show a maximum of 5 events and contains the following values for each of the events:
- Event ID : Contains a hyperlink that identifies the event. When you select the hyperlink, the Primary Event window appears, displaying the details of the selected Primary Event. In this window, you can only view the details of the event. You cannot modify the details.
- Event Type: Contains the type of event.
- Impact: Contains the loss that occurred due to the event.
- Start Date: Contains the date and time when the event began.
- End Date: Contains the date and time when the event ended.
The colors that represent various fields in these graphs appear based on the color that you specify when adding an Event Type.
-
Breakdown of Period Hours: Contains a doughnut graph that shows the percentage of following for the specified period for the selected GAA Unit:
- Good Production
- Planned Derate
- Planned Outage
- Reserve Shutdown
- Unplanned Derate
- Unplanned Outage
The colors that represent various fields in this graph appear based on the color that you specify when adding an Event Type or Event Category.
When you select a slice in the graph, the types of events in that category are plotted on a bar graph next to the doughnut graph.
When you hover over or select a slice in the graph, the number of hours and percentage of sum of values of the each of the fields appears.
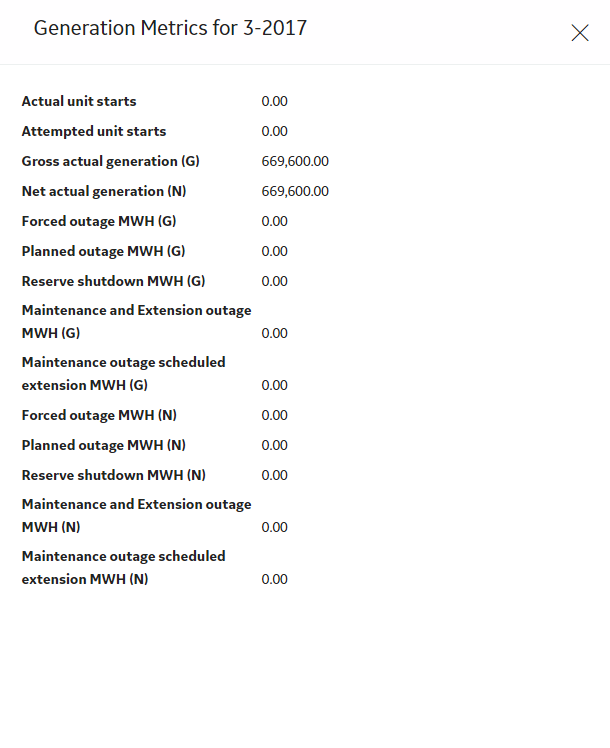
Generation Metrics: Contains a graph that shows the performance of the GAA Unit during the specified period.
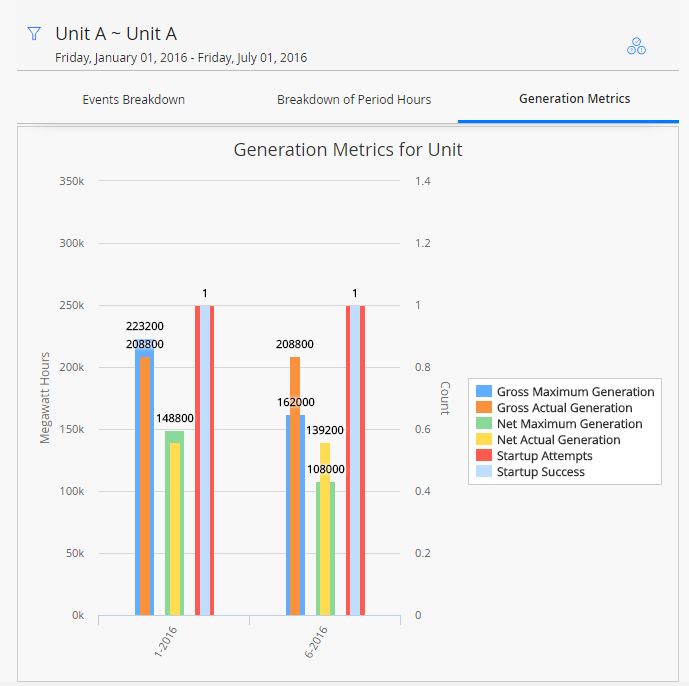
The graph shows the following fields represented in the vertical bar graph format:
- Gross Maximum Generation: Contains the sum of values in the Gross Maximum Generation (MWh) field for all events during the specified period.
- Gross Actual Production (MWh): Contains the sum of values in the Gross Actual Generation (MWh) field for all events during the specified period.
- Net Maximum Production (MWh): Contains the sum of values in the Net Maximum Production (MWh) field for all events during the specified period.
- Net Actual Production (MWh): Contains the sum of values in the Net Actual Production (MWh) field for all events during the specified period.
- Startup Attempts (Count): Shows the sum of values in the Attempted Unit Starts field for all events during the specified period.
- Startup Success (Count): Shows the sum of values in the Actual Unit field for all events during the specified period.
-
Event Timeline: Contains a graph that shows the loss in the GAA Unit during the specified period.
The x-axis represents the period. The y-axis represents the loss in megawatts. When you select or tap a bar in the graph, following details for the selected Event appear:
- Event Type
- Loss
- Start Date
- End Date
On the Timeline slider, you can select the duration for which you want to view the losses for the GAA Unit.
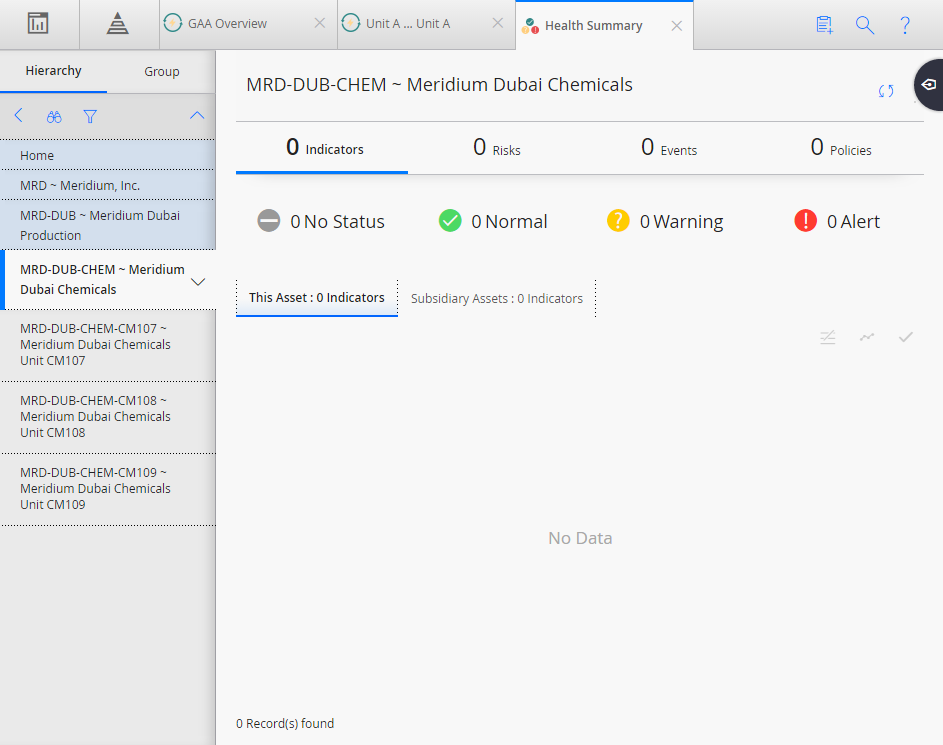
You can also view the Health Summary page for an Asset if the selected GAA Unit is associated with an Asset. Also, make sure that the Asset Health license is active and that you are member of one of the following Asset Health Manager Security Groups:
- MI AHI Administrator
- MI AHI User
- MI AHI Viewer
To view the Health Summary page for an Asset, in the upper-right corner of the Unit Summary workspace, select  .
.
GAA Workflow
This workflow provides the basic, high-level steps for using GAA. The steps and links in this workflow do not necessarily reference every possible procedure.
-
Create Primary Events to record data to represent each event in which units suffer a loss of power generation capacity.
- Create Contributing Events to represent events related to the Primary Event and link them to the Primary Event. This is required only if you selected NERC as your Primary Regulatory Organization in the GAA Unit record.
- Create Performance records to gather event statistics and link it to the GAA Unit record that represents the unit for which the Performance record stores data. This is required only if you selected NERC as your Primary Regulatory Organization in the GAA Unit record.
- Update Performance records to make sure that all the Performance records for the reporting period are up-to-date. This is required only if you selected NERC as your Primary Regulatory Organization in the GAA Unit record.
- Report data to NERC or CEA. You should run reports after the end of each reporting period. The reporting periods and the schedule on which you should report data are defined by the organization to which you are reporting the data.