RBI 581 ISO Risk Plot
About the RBI 581 ISO Risk Plot
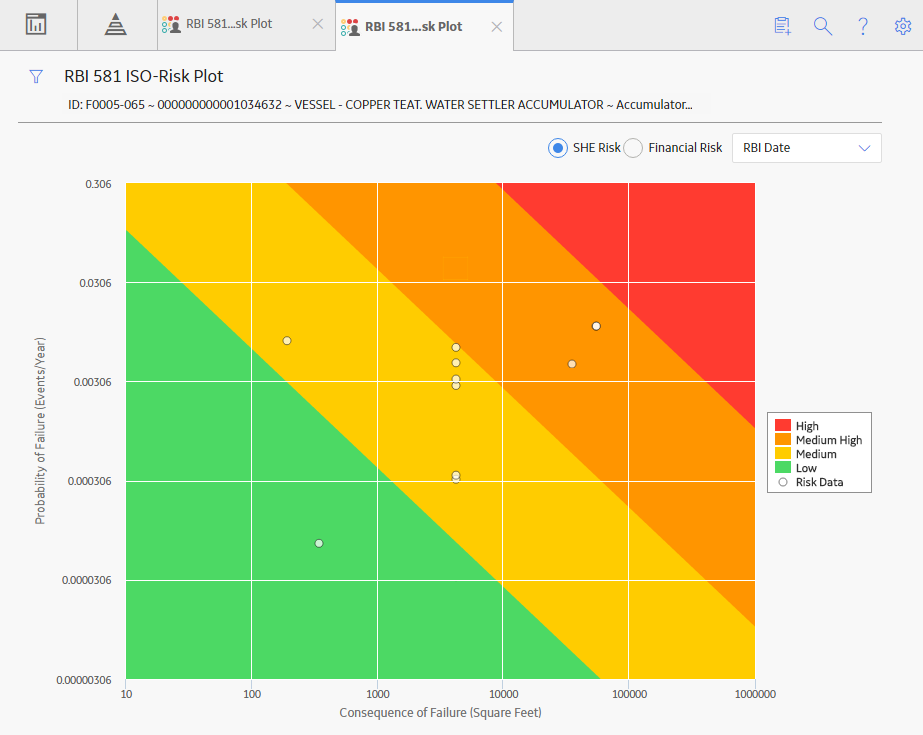
The RBI 581 ISO Risk Plot is a graph that plots the SHE risk and financial risk of:
- A single RBI 581 Risk Analysis.
- All RBI 581 Risk Analyses in a process unit, asset, corrosion loop, or component. In this scenario, the risk data of all the analyses in Risk Completed, Accepted by ASM, Pending Approval, or Approved state are plotted on the graph.
By default, the graph for the SHE risk appears. If you want to view the graph for the financial risk, you must select the Financial Risk tab.
For SHE risk:
- Consequence of Failure (in square feet) is plotted on the horizontal axis, using a logarithmic scale.
- Probability of Failure (in events per year) is plotted on the vertical axis, using a logarithmic scale.
For financial risk:
- Consequence of Failure (in USD) is plotted on the horizontal axis, using a logarithmic scale.
- Probability of Failure (in events per year) is plotted on the vertical axis, using a logarithmic scale.

By default, the risk on the RBI date is plotted. If you want the without plan risk or the with plan risk to be plotted, then on the upper-right corner of the page, in the Risk Data box, select the appropriate option.
The background color for various sections in the graph indicate the risk levels as defined by the International Organization for Standardization (ISO).
| Background color | Risk Level |
|---|---|
| Red | High |
| Orange | Medium High |
| Yellow | Medium |
| Green | Low |
If you hover over a data point, then the ID of the analysis, the ID of the associated asset, the consequence of failure, probability of failure, and risk data of the analysis appear. If you select the data point, the Asset Summary page appears, displaying the analysis datasheet in the Analysis Details section.
Fields Used in Plotting Risk Data
The following fields provides a list of fields that are used to plot risk data on the RBI 581 ISO-Risk Plot.
| Family | Fields |
|---|---|
| RBI 581 Risk Analysis | Total Financial Risk Without Plan |
| Total POF Without Plan | |
| Total SHE Risk Without Plan | |
| Total Financial Risk With Plan | |
| Total POF With Plan | |
| Total SHE Risk With Plan | |
| Total Financial Risk - RBI Date | |
| Total POF - RBI Date | |
| Total SHE Risk - RBI Date | |
| RBI 581 Consequence Evaluation | Final Consequence Area |
| Total Financial Consequence |
Access the Inventory Groups in a Process Unit
About This Task
You can also access the inventory group of a component.
Procedure
- In the upper-right corner of the workspace, select
 , and then select Inventory Group.
The RBI 581 Inventory Groups workspace appears on a new page, displaying a list of inventory groups in the process unit in the left section and the datasheet for the corresponding Functional Location in the details section.

Tip: If you are a member of the RBI Admin Security Group, you can create an Inventory Group Configuration record in the RBI 581 Inventory Groups workspace.
Access the RBI 581 ISO Risk Plot Page of a Functional Location
About This Task
You can also access the RBI 581 ISO Risk Plot page for an asset, corrosion loop, component, or analysis.
- Risk Completed
- Accepted by ASM
Procedure
- On the upper-right corner of the page, select
 .
.The RBI 581 ISO-Risk Plot page appears, displaying the SHE Risk.
Note: By default, the risk on the RBI date is plotted. If you want the without plan risk or the with plan risk to be plotted, then on the upper-right corner of the page, in the drop-down list box, select the appropriate option. - If you want to select a different functional location, then:
-
On the upper-left corner of the page, select
 .
.The Enter Parameter Values window appears.

-
Select the process unit that is already set as the context.
The Hierarchy window appears.

-
Navigate to the process unit whose ISO risk plot you want to access, and then select Done.
The Hierarchy window closes.
-
On the Enter Parameter Values window, select Done.
The ISO risk plot for the selected functional location appears.
-
Access the RBI 581 ISO Risk Plot Page of an Asset
About This Task
- Risk Completed
- Accepted by ASM
Procedure
- On the upper-right corner of the page, select , and then select RBI 581 ISO-Risk Plot.
The RBI 581 ISO-Risk Plot page appears, displaying the SHE Risk.
Note: By default, the risk on the RBI date is plotted. If you want the without plan risk or the with plan risk to be plotted, then on the upper-right corner of the page, in the drop-down list box, select the appropriate option.
Access the RBI 581 ISO Risk Plot Page of a Corrosion Loop
About This Task
- Risk Completed
- Accepted by ASM
Procedure
- On the upper-right corner of the page, select .
The RBI 581 ISO-Risk Plot page appears, displaying the SHE Risk.
Note: By default, the risk on the RBI date is plotted. If you want the without plan risk or the with plan risk to be plotted, in the upper-right corner of the page, select the appropriate option in the drop-down list box.
Access the RBI 581 ISO Risk Plot Page of a Component
About This Task
- Risk Completed
- Accepted by ASM
Procedure
- On the upper-right corner of the page, select .
The RBI 581 ISO-Risk Plot page appears, displaying the SHE Risk.
Note: By default, the risk on the RBI date is plotted. If you want the without plan risk or the with plan risk to be plotted, then on the upper-right corner of the page, in the drop-down list box, select the appropriate option.
Access the RBI 581 ISO Risk Plot Page of an Analysis
About This Task
You can also access the RBI 581 ISO Risk Plot page for a functional location, asset, corrosion loop, or component.
Procedure
- In the workspace heading, select the Risk Matrix tab.
The Risk Matrix section appears, displaying the ISO risk plot.

Note: By default, the risk on the RBI date is plotted. If you want the without plan risk or the with plan risk to be plotted, then on the upper-right corner of the page, in the drop-down list box, select the appropriate option.