Reliability Analytics: Overview
Overview of the Reliability Analytics Module
- A means for analyzing historical failure data to identify trends and predict future failures.
- A mechanism for simulating what if scenarios regarding the reliability of a system to determine if a new or modified strategy will be effective.
- Production Analysis
- System Reliability Analysis
- Spares Analysis
- Reliability Distribution Analysis
- Probability Distribution Analysis
- Reliability Growth Analysis
- Automation Rules
Access the RA Overview Page
About This Task
This topic describes how to access the RA Overview page, on which you can view all the information and perform various tasks to improve reliability of various Asset Hierarchy Levels.
You can perform the various tasks on this page based on the Security Groups you are assigned.
Procedure
The RA Overview page appears.
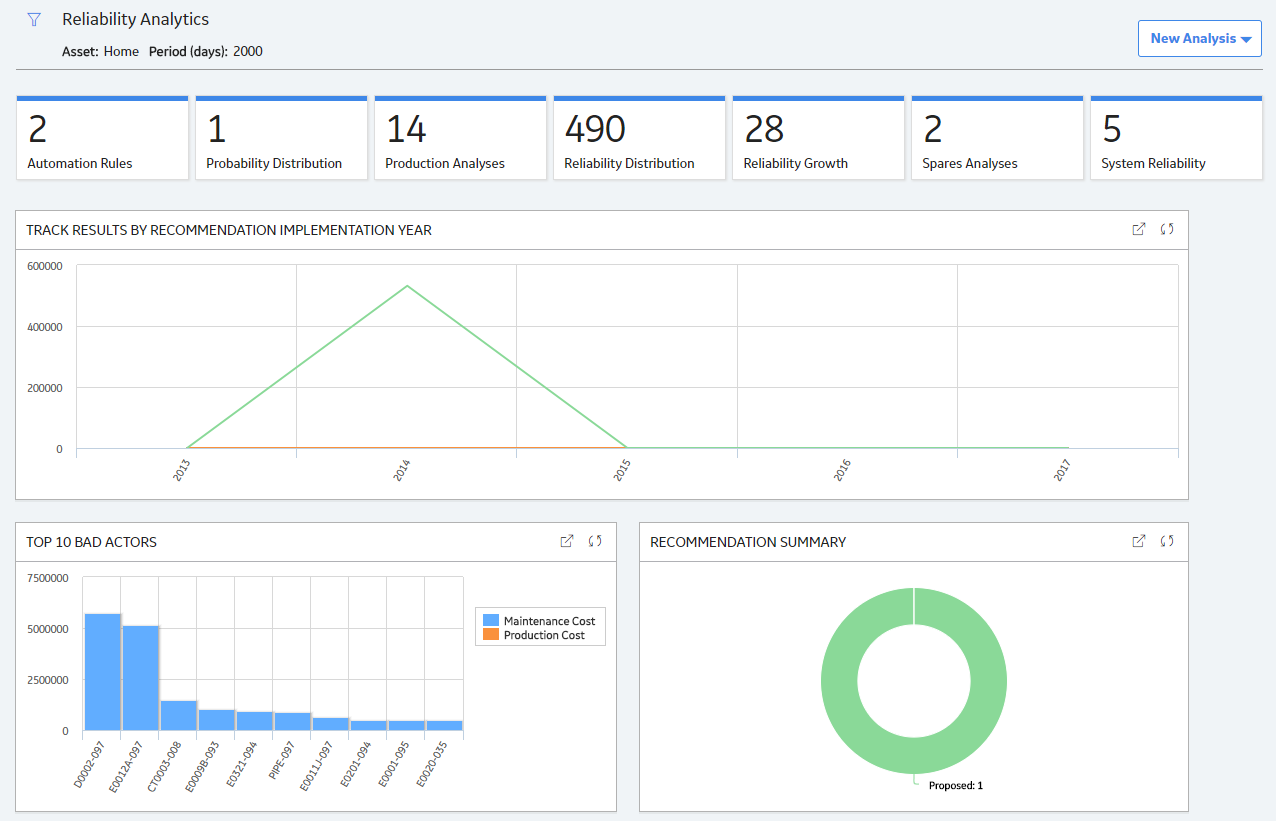
The tabs at the top of the page summarize the number of items in each category. You can select a tab to view one of the following lists:
- Automation Rule: Contains a list of Automation rules available in the database. To access this tab, you must be a member of the MI Reliability Administrator Security Group or a Super User.
- Probability Distribution: Contains a list of Probability Distribution Analyses available in the database.
- Production Analyses: Contains a list of Production Analyses available in the database.
- Reliability Distribution: Contains a list of Reliability Distribution Analyses available in the database.
- Reliability Growth : Contains a list of Reliability Growth Analyses available in the database.
- Spares Analyses: Contains a list of Spares Analyses available in the database.
- System Reliability: Contains a list of System Reliability Analyses available in the database.
On the page, you can also view the following sections:
-
Track Results By Recommendation Implementation Year: Contains a line chart that displays yearly performance of Hierarchy Levels on which Reliability Recommendations have been implemented. The chart displays the sum of all the maintenance costs and production costs associated with all the Hierarchy Levels related to the Reliability Recommendation. The chart plots the sum of the maintenance costs and production costs of the Hierarchy Levels for the current year and the previous four years.
By default, the Track Results By Recommendation Implementation Year graph excludes the production costs associated with Production Loss Analysis (PLA). If you want to include the production costs associated with PLA in this graph, you need an active license for PLA, access to the required PLA families, and use RATrackResultsByRecommendationWithPLA graph, which is available in the Public\Meridium\Modules\Reliability Manager location. To use this graph, you must modify the Reliability Dashboard Dashboard configuration in the Public\Meridium\Modules\Reliability Manager folder.
-
Top 10 Bad Actors: Contains a chart that plots the losses that were contributed by the top 10 causing Hierarchy Levels for a given time period. The losses represented here are the sum of Maintenance Costs and the Production Losses caused by the causing Hierarchy Levels. You can also include the sum of Total Losses in the graph by modifying the query. When you include this category, the graph is updated to include one additional slice, which represents the Total Losses. By default, this chart shows values for last 90 days.
You can hover or tap on any datapoint for a Hierarchy Level to view:
- The name of the causing Hierarchy Level.
- Losses contributed by the causing Hierarchy Level.
By default, the Top 10 Bad Actors chart excludes production costs associated with Production Loss Analysis (PLA). If you want to include the production costs associated with PLA in this graph, you need an active license for PLA, access to the required PLA families, and use of the RATrackResultsByRecommendationWithPLA graph. To use this graph, you must modify the configuration of the Reliability Dashboard, which is found in the folder Public\Meridium\Modules\Reliability Manager.
- Recommendation Summary: Contains a chart that displays the number of Reliability recommendations filtered by state.
While viewing any of the charts, you can select  to customize the appearance of the chart by using standard graph features.
By default, the hierarchy level is set to Home. You can filter the hierarchy level by selecting  on the upper-left corner of the page. When setting to an asset or functional location in the hierarchy, only those analyses linked to the selected asset and its children, or to the selected functional location will appear. You can specify the time period for information that appears on the tabs or charts by entering the desired time period in the Period box.