TML Groups
About TML Groups
A TML Group is a group of TMLs that represent a component of an asset.
Details
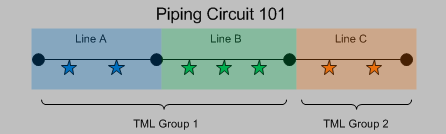
Suppose you have an asset, Piping Circuit 101, ) which contains three components, Line A, Line B, and Line C. On those components, there are multiple TMLs. The following image illustrates this example, where the components are represented by shaded regions, and the TMLs are represented by stars.

For a given asset, a TML Group can represent:
- All TMLs that exist on that asset. You would create a TML Group to represent all TMLs that exist on an entire asset if the asset is a standalone asset. You would create one TML Group to represent all of the stars.

-
A subset of TMLs that exist on one or more components that belong to the asset. Using this option, you could create:
-
One TML Group per component, where the TML Group represents all TMLs that exist on that component. You would create three TML Groups, one to represent each set of stars.

-or-
-
One TML Group for multiple components, where the TML Group represents all TMLs that exist on those components. Using the previous Piping Circuit 101 example, you could create two TML Groups, where one represents the blue and green stars and one represents the orange stars.
-
Additionally, throughout the life of the asset, you might identify one or more TMLs within a TML Group that you want to analyze separately from other TMLs. In this case, you can create additional TML Groups to represent any subdivision of an existing group of TMLs.
For example, suppose that an asset that you are analyzing in Thickness Monitoring represents a shell and tube heat exchanger. The shell and tube heat exchanger has two components, the shell side and the tube side, each with its own process flow. Since the corrosion environments of these components will differ, you might create the following TML Groups:
- TML Group - Shell Side
- TML Group - Tube Side
When you first begin analysis on the shell and tube heat exchanger, you are not sure what the TM corrosion data will show, (i.e., whether TML Group - Shell Side or TML Group - Tube Side will have more aggressive corrosion). After you have completed some analysis on the shell and tube heat exchanger, you notice that a subset of TMLs on the shell side near the nozzle have very high corrosion rates. At this point, you create a third TML Group, TML Group - Shell Nozzle to represent this component, and you move the TMLs associated with this component from TML Group - Shell Side to TML Group - Shell Nozzle.
Regardless of what they represent, all TML Groups in a Corrosion Analysis will be linked directly to a single asset. If you decide to use TML Groups, all TMLs in your Corrosion Analysis should be linked directly to TML Groups (rather than the asset to which the TML Groups are linked).
About Equipment and TML Groups
Each Corrosion Analysis begins with an asset for which you want to monitor corrosion. The asset you want to monitor may consist of a number of components you want to monitor independently. If so, you can create a TML Group for each component to contain the TMLs that are for that specific component.
Details
Before you can conduct a Corrosion Analysis on an asset, an Equipment record must exist in the GE Digital APM database to represent the asset on which you want to perform the corrosion analysis. The types of records that you create in your Corrosion Analyses will depend upon what your Equipment records represent.
Before you can create TML Groups, an Asset Corrosion Analysis and Corrosion Analysis Settings must be created for an asset, represented by an Equipment record. Equipment records can be created manually via Record Manager, or they may be loaded into your database from another data source (e.g., SAP). After assets exist, you can create TML Groups.
Example: Using Piping Circuits to define TML Groups
Consider, for example, a piping circuit that contains three piping lines. You might want:
-
One Equipment record to store all of the information for the piping circuit and the three piping lines.
-or-
- One Equipment record to store information for the piping circuit and three TML Groups to store information for the individual piping lines (one TML Group for each piping line). These TML Groups would be linked directly to the Equipment record that stores information for the piping circuit.
About Corrosion Analyses that Include TML Groups
You should include TML Groups in your Corrosion Analyses if any of the assets that you will analyze in TM consist of components that you want to analyze individually, or you want to analyze corrosion data for certain groups of TMLs on an asset or component. What the TML Groups that you create represent will depend upon whether the associated Equipment record represents a standalone asset or an asset that contains components.
If you use this method:
- You must configure preferences for the Equipment family.
- Each TML Group that you create will be linked to an Equipment record representing the asset through the Has TML Group relationship.
- An Asset Corrosion Analysis and Corrosion Analysis Settings will be created and linked to the Equipment record representing the asset, as well as each TML Group that is linked to that asset.
- All TMLs that you create will be linked directly to a TML Group. In this case, TMLs should not be linked directly to the asset.
Details
The following diagram illustrates the structure of Corrosion Analyses that include TML Groups. Specifically, this diagram illustrates the records and links that would exist if a Corrosion Analysis included one Equipment record (representing an asset), which is linked to three TML Groups. The boxes in the diagram are labeled according to the records that they represent, and the lines connecting the boxes represent the links between these records in a Corrosion Analysis.

The following table provides information on how the records that are illustrated in the diagram are created manually or automatically.
| Record | Notes |
|---|---|
| Corrosion Analysis Settings |
Manually for Equipment records -and- Automatically for TML Groups that you create and link to those equipment records. |
| Asset Corrosion Analysis | Automatically for Equipment records and TML Groups, but at different points in the workflow. |
| Equipment | Manually. |
| Thickness Measurement | Manually. |
| Thickness Measurement Location | Manually. |
| Thickness Monitoring Task | Automatically (when a Corrosion Analysis Setting are created). |
| TML Corrosion Analysis | Automatically (when a Thickness Measurement Location record is saved). |
About Corrosion Analyses that Exclude TML Groups
You can exclude TML Groups from your TM analyses if none of the equipment that you will analyze in TM contain components, or if you want to analyze an asset without considering the components individually.
If you use this method:
- Asset Corrosion Analyses and Corrosion Analysis Settings will be created and linked to each Equipment record.
- All TMLs that you create will be linked directly to Equipment records representing assets.
Details
The following diagram illustrates the structure of Corrosion Analyses that do not include TML Group records. The boxes in the diagram are labeled according to the records that they represent, and the lines connecting the boxes represent links between these records in a Corrosion Analysis.
The following table provides information on how the records illustrated in the diagram are created manually or automatically.
| Record | Notes |
|---|---|
| Corrosion Analysis Settings |
Automatically. |
| Asset Corrosion Analysis | Automatically (when a Corrosion Analysis Setting are created for an Equipment record). |
| Equipment | Manually. |
| Thickness Measurement | Manually. |
| Thickness Measurement Location | Manually. |
| Thickness Monitoring Task | Automatically (when a Corrosion Analysis Setting are created). |
| TML Corrosion Analysis | Automatically (when a Thickness Measurement Location record is saved). |
About TML Groups and RBI Components
You can use TML Corrosion Analyses to determine corrosion rates in Risk Based Inspection (RBI). To complete the analysis, you must perform key steps in this workflow within the RBI module. If you want to specify that TML Group values should be used to calculate RBI corrosion rate values, you can perform this step using TM rather than RBI. Before you can link an RBI Component to a TML Group, you must first create an RBI Component for the asset, and then set the Source of Calculated Corrosion Rate field for the component to Component.
Details
To complete this task, you will need to link a TML Group to a Criticality Calculator RBI Component. When you link a Criticality Calculator RBI Component to a TML Group, RBI corrosion rate values for the RBI Analysis that you create are based on the average of the following values in the TML Corrosion Analysis:
- Long Term Corrosion Rate
- Short Term Corrosion Rate
In other words, the values in the preceding list will determine the following values in the Criticality Int. Corr. Deg. Mech. Eval record associated with the RBI Analysis that is created from the linked TML Group record:
- Short Term Avg. Corr. Rate
- Long Term Avg. Corr. Rate
Create a TML Group
Procedure
- In the left pane, select
 , and then select TML Group.
The Select Analysis Type window appears.

Results
- The TML Group ID is automatically generated.
- The TML Group inherits the Corrosion Analysis Settings from the asset.
- You can make changes to the TML Group by accessing the datasheet.
Access a Thickness Measurement Location (TML)
About This Task
This topic describes how to access a TML via the Analysis Overview workspace for an asset or TML Group. You can also access the Analysis Overview workspace directly for a TML.
Procedure
- In the workspace, select the TMLs tab.
The TMLs section appears, displaying the following information:
- If you selected an asset, a list of TMLs linked to the asset appears. This list includes TMLs linked to TML Groups or subcomponents linked to the selected asset.
- If you selected a TML Group, a list of TMLs linked to the TML Group appears.
- The color-coding categories appear at the top of the section. The number in parentheses next to each category indicates the number of TMLs in each category.
- The visual cue that appears in each row indicates the color-coding category that is applicable to the TML.

Tip: In the TMLs section, you can:- Select a color-coding category to filter the list of TMLs in that category. For example, if you select Below T-Min, the TMLs that meet the criterion for Below T-Min appear. You can remove the filter by selecting the same category again.
- Delete a TML by selecting
 .
.
- In the row containing the TML that you want to access, select the link.The Analysis Output section appears, displaying a summary of the associated TML Corrosion Analysis.

- If you want to access the TML datasheet, select the TML Details tab.The TML Details section appears, displaying the TML datasheet.

 to save your changes.
Configure the Thickness Monitoring Location (TML) Section
About This Task
You can configure the grid in the TMLs section by adding or removing fields using the Choose Columns window.
Procedure
- In the Analysis Overview workspace, select the TMLs tab.The TMLs section appears.
- In the TMLs section, select
 .The Choose Columns window appears.
- In the Choose Columns window, in the Available Fields section, select the fields you want to appear in the grid, and then select
 .Tip: To remove a field from the grid, in the Choose Columns window, in the Display Fields section, select the field you want to remove from the grid, and then select
 .
. - Optionally, to reorder the fields in the Display Fields section, select


Results
- The TML grid configuration is saved as a user preference.
- The fields added via the Choose Columns window also appear in the following areas:
- The Renew TMLs window
- The Exclude TMLs window
- The Organize TMLs window
- The Relocate TMLs workspace
Copy Thickness Measurement Locations (TMLs)
Procedure
- In the upper-right corner of the page, select
 , and then select Copy TML.The Copy TML window appears.
Relocate a Thickness Measurement Location (TML)
About This Task
You can relocate TMLs to move TMLs from a source asset or TML Group to a different target asset, or to a TML Group or subcomponent linked to that target asset. If you need to move TMLs to or between subcomponents linked to the same asset, use the Organize TMLs method.
Procedure
- Select , and then select Relocate TMLs. The Relocate TMLs workspace appears.

- Select Select an Asset.The Select Target window appears.

Results
Renew Thickness Measurement Locations (TMLs)
Procedure
- Select , and then select Renew TMLs. The Renew TMLs window appears, displaying a list of the TMLs linked to the asset or TML group.

- Select Renew TMLs.The renewal of TMLs starts and the renewal progress appears in the upper-right corner of the Renew TMLs window.
 Tip: The renewal process continues even if you close the Renew TMLs window. You can view the progress of the job from the Schedule Logs. In case any TML fails to renew, the job is placed in the Failed section of the Schedule Logs page.
Organize Thickness Measurement Locations (TMLs)
About This Task
You can organize TMLs to move TMLs to or between TML Groups and subcomponents associated with the same asset. If you want to move TMLs to another asset, or to a subcomponent of that asset, you should relocate those TMLs.
Procedure
- In the upper-right corner of the workspace, select , and then select Organize TMLs. The Organize TMLs workspace appears, displaying a list of TMLs linked to the asset to which the TML Group or subcomponent you selected in step 1 is linked. This list includes TMLs linked to all TML Groups and subcomponents that the asset contains, including the one that you selected in step 1.

Note: If you do not see the TMLs that you expect, or want to limit the list, in the upper-left corner of the workspace, confirm the setting in the Analysis Type list, and whether the Active TMLs Only check box is selected.
Exclude a Thickness Monitoring Location (TML)
Before You Begin
- Only MI Thickness Monitoring Administrator and members of the MI Thickness Monitoring Inspector Security Group can exclude TMLs from an analysis.
Procedure
- In the workspace, select the TMLs tab.A list of TMLs contained in the analysis appears in the workspace.
- In the upper-right corner of the workspace, select , and then select Exclude TMLs.The Exclude TMLs window appears, providing a list of TMLs in the analysis. If a TML has already been excluded, the corresponding check box is selected.

- Select Done.The selected TMLs are excluded from the analysis.
 .
.
Access the TM Quick View Page
About This Task
The TM Quick View page displays a list of TMLs in an asset or TML Group, along with details on the corrosion rate, next inspection date, measurements taken in each month, and so on.
Procedure
- Select , and then select Quick View. The TM Quick View page appears.

Note: The unit of measure displayed on the grid is based on your selections on the Units of Measure and Conversion Set page.The TM Quick View page displays the following information:- From the Thickness Measurement Location family:
- Minimum Thickness
- TML Analysis Type
- TML Asset ID
- TML IDTip: You can select the link in the TML ID column to access the Analysis Overview page corresponding to a TML.
- From the TML Corrosion Analysis family:
- Corrosion Rate
- Projected T-Min Date
- Scheduled Next Inspection Date
- From the Thickness Measurement family:
- <Month><Year>: Contains a list of measurements for the month and year displayed in the column heading, separated by a semicolon.
Note: By default, the TM Quick View page displays measurements taken in the past ten years. If you want to modify the data range, in the upper-left corner of the page, select
- From the Thickness Measurement Location family:
Link a TML Group to RBI Components
Before You Begin
About This Task
Procedure
- In the workspace, select , and then select Manage RBI Components.The Manage RBI Components window appears.

Results
- RBI Components linked to TML Groups inherit the corrosion rate values from the TML Groups. The resulting RBI Analysis is based on the average of the following values in the TML Corrosion Analyses linked to the TML Group:
Delete a Thickness Monitoring Location (TML) Group
Before You Begin
- When you delete a TML Group, the following linked records are also deleted:
- TMLs
- Thickness Measurements
- Corrosion Analysis Settings
- TML Corrosion Analyses
- Asset Corrosion Analyses
Procedure
- Select , and then select Delete.
A message appears, asking you to confirm that you want to delete the TML Group.