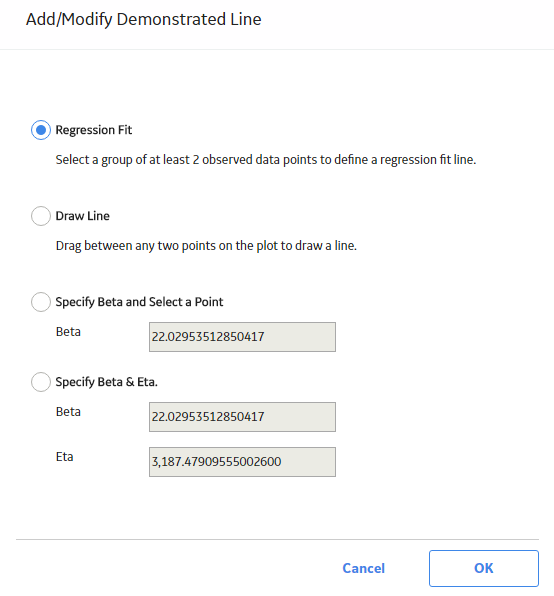
On the Add/Modify Demonstrated Line window, select Regression Fit, and then select OK.
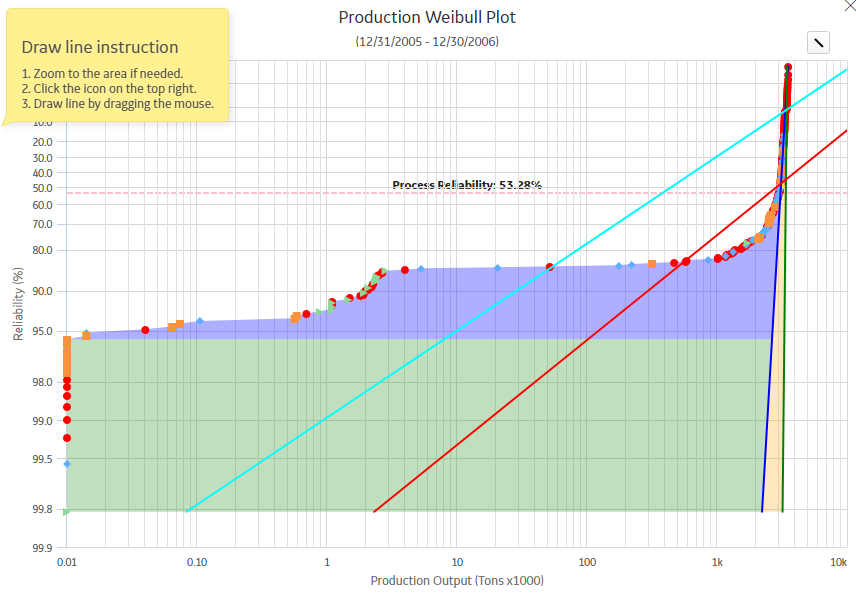
The Production Data plot appears in a new window.

Drag the pointer or use the standard spread move to create a box around at least two datapoints.
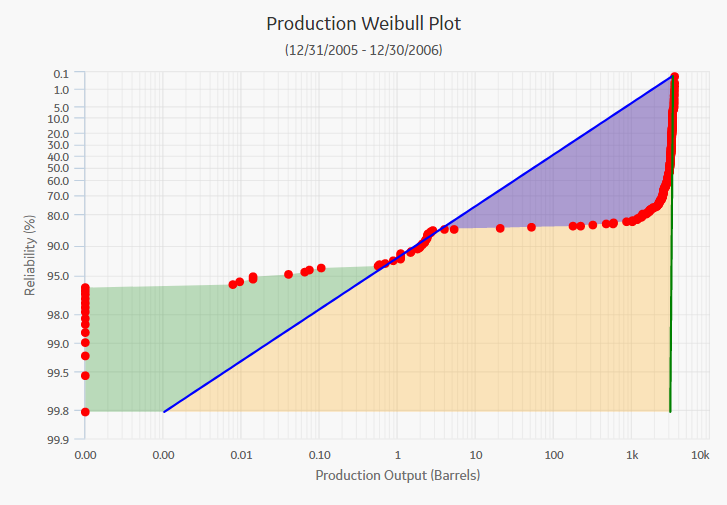
The Demonstrated Line is added to the Production Data plot.
Note: If you attempt to draw a regression fit around datapoints where the Beta value will be close to zero or too vertical and Eta will be too large or small or not present on the graph, an error message appears, explaining that Eta is out of range.
The following image shows an example of a line drawn using the Regression Fit method:
