- Create a Spares Analysis
- The Spare analysis must contain at least one:
If the analysis does not meet this minimum requirement, when you attempt to run the Monte Carlo simulation, an error message appears, explaining which record(s) are missing.
When you run a Monte Carlo simulation, calculations are performed on the delivery time, downtime, lost production costs, and failure and repair data to determine how many spare parts should be kept on hand at any given time. A Monte Carlo simulation performs these calculations many times for every spare part. The exact number of times the calculations are performed is determined by the value in the Number of Iterations box in the Analysis Summary workspace for the selected Spares Analysis. After a Monte Carlo simulation has been run, you can view its results on any of the Spares Analysis plots.
The plots will contain results from the last time the Monte Carlo simulation was run. Therefore, if you edit any data on any record that might affect the results of the Monte Carlo simulation, you should re-run the simulation before viewing the plots. Otherwise, the plots might contain results that do not match the most current data.
You can run only one simulation at a time for an analysis. For example, if you are running a simulation for Analysis A, you cannot run another simulation for Analysis A. You can, however, run a simulation for Analysis A while running the simulation for Analysis B. While a simulation is running, you can continue working in other areas of the GE Digital APM Framework.
If the analysis does not meet this minimum requirement, when you attempt to run the Monte Carlo simulation, an error message appears, explaining which record(s) are missing.
Steps
Access the Spares Analysis for which you want to run a simulation.
In the left pane, select Run Simulation.
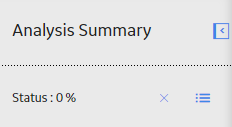
Simulation begins and the status appears in the left pane, indicating the progress of the simulation in percentage.

Note: You can select
After the simulation is complete, a confirmation message appears in the top right corner of the page. The plots display the updated results.
Copyright © 2018 General Electric Company. All rights reserved.