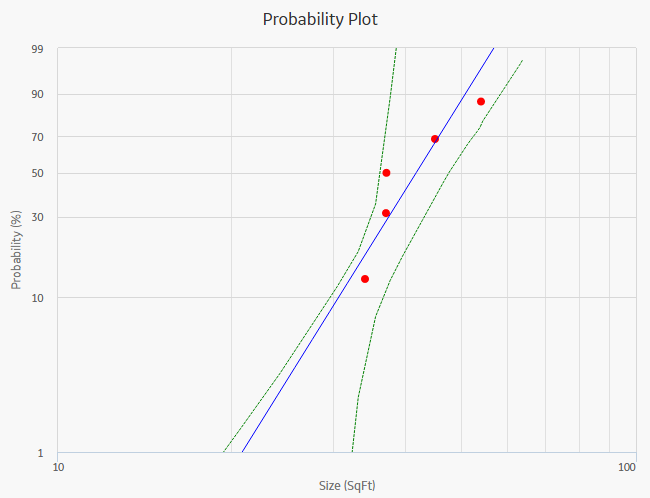
The Probability Plot is a log-log plot with data overlay and confidence limits that graphically displays the probability (expressed as a percentage) of each possible value of the random variable (CDF Occurrence % vs. time). CDF Occurrence % used here is numerically equal to the value from the cumulative distribution.
Note: Time used here refers to life data, not calendar data.

The Probability Plot shows the same data as the CDF plot, just represented in a log-log format. The log-log format reflects the standard technique for representing Weibull Distribution. Log-log format Data overlay gives a visual estimate of Goodness of Fit (GOF). Data overlay also gives clues to the presence of multiple failure modes. If a single or multiple inflection points exist in the data, then there is a possibility of multiple failure modes.
Note: Interaction with charts is not available on touch-screen devices.
While accessing a Probability Plot, you can:
Hover or tap on any datapoint to view the coordinates and the details of a datapoint.
Click or double-tap on any observed datapoint to view the data on the Distribution Data window.
Copyright © 2018 General Electric Company. All rights reserved.