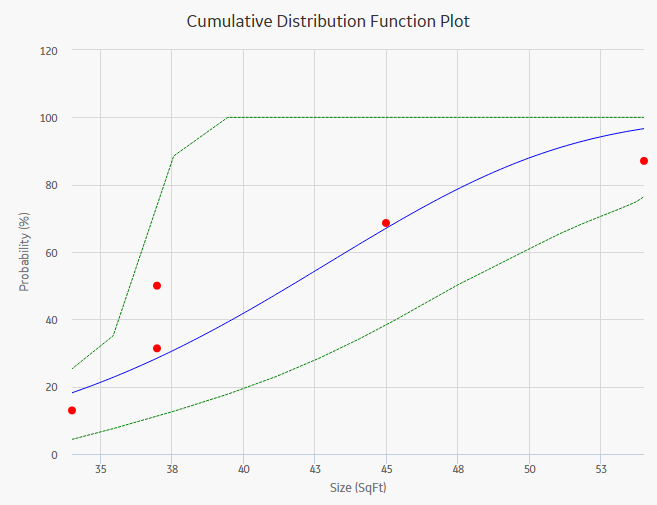
The Cumulative Distribution Function (CDF) plot is a lin-lin plot with data overlay and confidence limits. It shows the cumulative density of any data set over time (i.e., Probability vs. size). The term Probability is used in this instance to describe the size of the total population that will fail (failure data or any other data) by size (SqFt).

CDF plot answers a different question than PDF. For example, "What is the probability of failure at Size (SqFt)?" The CDF curve is the area under the PDF curve. The CDF accumulates all probability of failure up to the point in time in question. Since the number of failures increases with increasing size, the slope of the curve is always positive, always increasing.
Note: Interaction with charts is not available on touch-screen devices.
While accessing a CDF plot, you can:
Copyright © 2018 General Electric Company. All rights reserved.