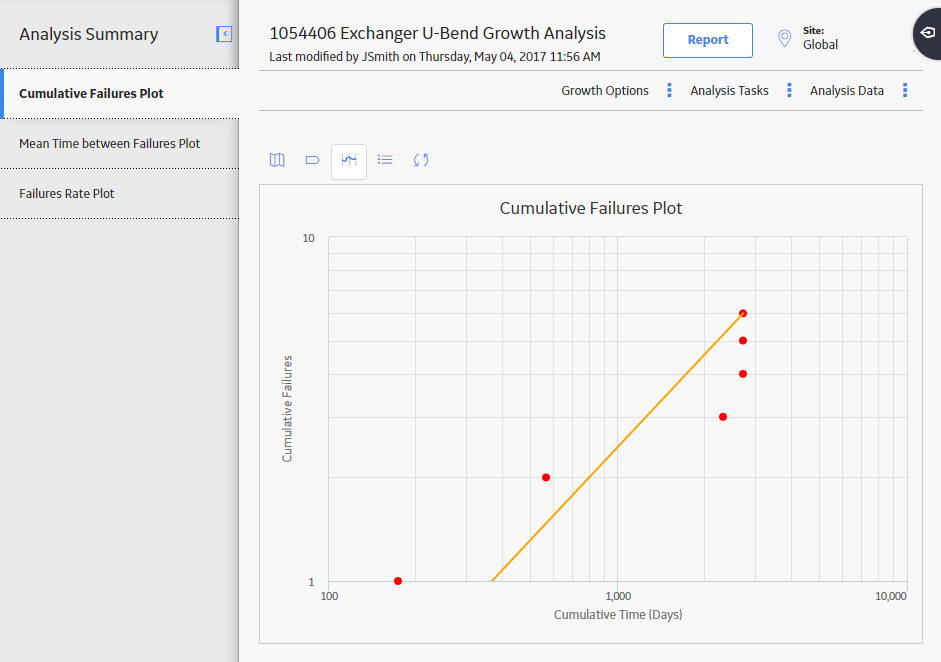
In the left pane, select the Cumulative <Measurement> Plot tab.
The Cumulative <Measurement> Plot appears in the workspace.

Note: You can also view data for a plot via the Mean Time Between <Measurement> Plot, and <Measurement> Rate Plot tabs.
In the upper-right corner of the workspace, select Analysis Data, and then select Go To Source.
The fields on the page that appear display the analysis data associated with the selected Probability Distribution Analysis and correspond to values that were used to create the analysis.
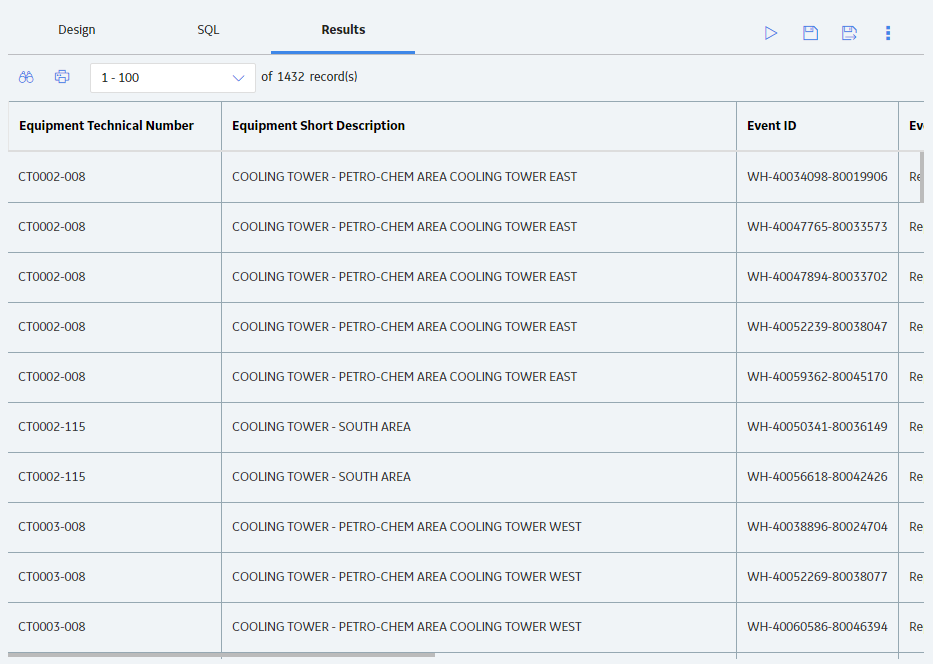
- For an analysis based on a query, the information returned by the query appears.
-
For an analysis based on a dataset, the information stored in the dataset appears.

-
For an analysis based on manually-entered data, you will receive the following error message:
There is no source data to view since the analysis is based on manually entered data.
To view data for an analysis based on manually-entered data, in the plot area, select an observed datapoint, and then select Go To Editor. The Reliability Growth Data window for the selected Reliability Growth Analysis appears. The row containing the data for the selected observed datapoint is highlighted.
Note: As needed, you can modify the values in the enabled fields, and then select Finish to save your changes.
- For an analysis that is based on manually entered data, the changes that you make via the Reliability Growth Data window will be saved for the analysis.
- For an analysis that is based on a query or a dataset:
- The query or dataset will not be modified with the updated data. Additionally, any record returned by the query will not be updated with your changes. The changes will be saved to the analysis only.
- After you modify the data and save the analysis, the modified data will appear each time you open the analysis. If you want to revert to the original data, you can reload the original data to the analysis. In addition, if a query or dataset has changed in the database, you can reload the data in order for your analysis to contain those changes.