Important: You do not have the latest version of Historian! You are missing out on the newest capabilities and enhanced security. For information on all the latest features, see the Historian product page. For more information on upgrades, contact your GE Digital sales agent or e-mail GE Digital Sales Support. For the most up-to-date documentation, go here.
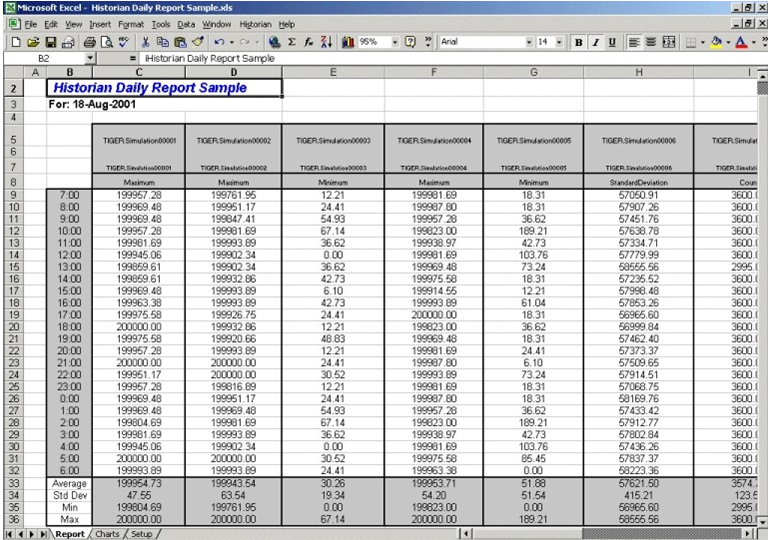
Daily Performance Sample Report
This sample report shows how the measured values and selected statistical properties of specified tags have varied during the previous 24-hour period. This sample is an example of a typical daily performance report in an industrial plant.
The report shown in the following figure is a collection of chart plots of the data displayed in the report of the previous figure.
The following figure shows the worksheet used to set up the Daily Sample Report. Edit the worksheet to adapt this report to your application.