Editors and Display Area
The user interface provides editors that allow you to create and modify trend charts and histogram charts, tables, and value cards as well as defining the Historian sampling mode and specific filters for requesting and displaying Historian tag values, and a main display area where you can view your output.
There are a number of options to help in creating and managing displays.
Editors Options
The Editors and Tools area provides new editors and tools to use in your analysis session.
Editors and Tools Area Description
The elements for the Analysis tab interface are described in the following table.
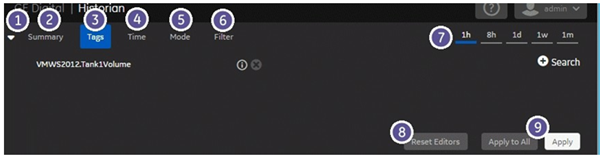
| Number | Component | Description |
|---|---|---|
 | Down Arrow | Toggles the expansion or collapse of the editor section. |
 | Summary | Displays the tags, time, mode, and filter for the item you selected. By default, the Summary view appears when you open the application. For more information on the Summary area, refer to Summary. |
 | Tags | Provides a Historian tag search and selection capability and then lists the tags that you have selected to use in your displays (active tags). You can add any of these active tags in displays that include trend charts, value cards, current value tables, text boxes, and filters. When you use a tag in a current value table, value card, or a trend chart a blue dot appears before the tag name indicating it is in use for the selected object. For more information on the Tags area, refer to Tags. |
 | Time | Allows you to configure the time range for which you want to view data within a chart by entering a start and stop time. Your System Administrator configures the time zone as either Local or UTC within the System Config tab accessible by clicking the Admin drop-down menu and then selecting System Config. The default is the last hour. For more information on changing the time zone, refer to System Config. For more information on the Time Editor, refer to Time Editor. |
 | Mode | Allows you to modify the way you request and display Historian tag values by first selecting a Historian Sampling Mode from a drop-down menu and then configuring the options that appear for that node. You can apply the mode to the currently selected chart or to all charts. The default is Interpolated, 1000 samples. For more information, refer to Mode Editor. |
 | Filter | Allows you to modify a condition by which to filter data from a Historian Server. You can choose to apply the filter to the current analysis item or you can Apply to All items in the Analysis session. This results in a new query to Historian and only the data that meets the filter criteria is returned to the chart. The default is no filter. For more information, refer to Filter Editor. |
 | Quick Time Picker | Provides an easy way to modify time in your charts. You can change the X-axis for a time-based chart by opening the chart and then clicking the Time of your choice. The following Quick Times are available:
|
 | Reset Editors | Allows you to reset all editors including Tags, Time, Mode, and Filter editors. It is not available from the Summary screen. |
 | Apply Apply to All |
Note: If there is a validation error in the Time Editor, then the Apply and Apply All buttons will be disabled.
|