
Brittany Singh: How Can We Stay Smarter Than Machines?


Data-visualization tool identifies sources of aberrant results and recomputes visualizations without them.
In the age of Big Data, visualization tools are vital. With a single glance at a graphic display, a human being can recognize patterns that a computer might fail to find even after hours of analysis.
Categories
Eight million homes and businesses without electricity after Superstorm Sandy in 2012, tens of thousands left in the cold by last winter’s polar vortex.

Power generation increasingly resembles an extreme sport — is your utility company ready for the next round?
Does Your Innovation Plan Make You Disruption-Ready?

Elastic Cloud Will Put Your Global Supply Chain on Firm Footing
Imagine that you are in charge of the service center for a global energy infrastructure company. It’s Friday afternoon and you are ready to go home when you receive an urgent call from a customer. She needs a critical oil pump component within the next 12 hours or her business will lose millions of dollars. Concerned? Don’t panic.

Survey: Companies ‘Disruption Ready’ as Anxiety Turns Into Action

Appetite for Disruption: Survey Finds Companies Keen on Fueling Innovation with Big Data

Cloud Mine

Making Fracking More Efficient With Prescriptive Analytics
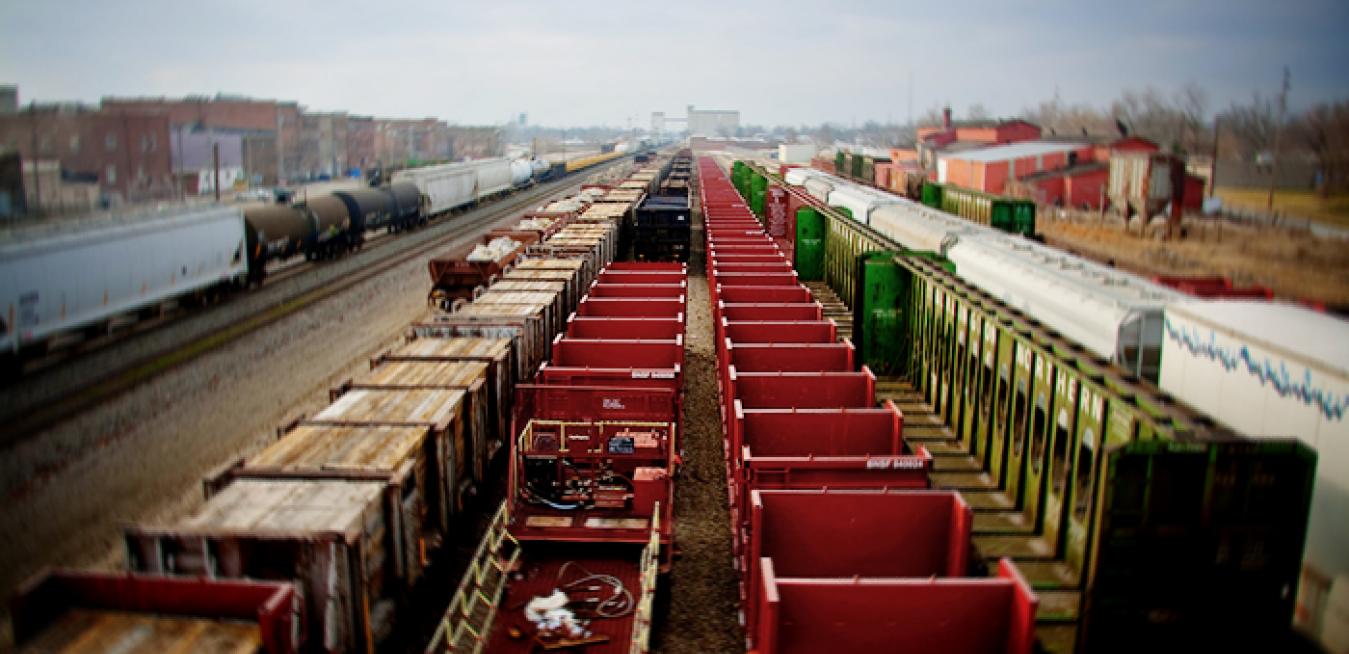
Rail’s on a Roll With Big Data
As the industry takes its message to lawmakers today during “Railroad Day” on Capitol Hill, the industry is on a roll. Revenue is up 19 percent since 2009 to $80.6 billion, creating 10,000 new directly related jobs and countless other ancillary jobs. Some $21 billion in wages were paid last year alone, a $1 billion increase from the year before.