Steps to Build a Test Picture
Overview
Use the steps below to create two data links in Configuration Hub that point to the following tags that contain simulation data from the IGS driver:
- A DI tag named Fix32.FIX.PUMP_STAT.A_CV, associated with the Simulation Examples.Functions.User3 I/O address.
- An AI tag named Fix32.FIX.PUMP_SPEED.F_CV, associated with the Simulation Examples.Functions.User2 I/O address.
After you create the tags in Configuration Hub, you can create your picture in the iFIX WorkSpace. We will insert two real-time data links into that picture, along with a trend chart to display the historical data for one of the tags. Then, we will put the picture in run mode to view simulated data.
Create Two Tags in Configuration Hub
Create Two Tags in Configuration Hub
To create two test tags in Configuration Hub, follow these steps:
- Open Configuration Hub: from the iFIX WorkSpace, click the Applications
tab, and then Configuration Hub.
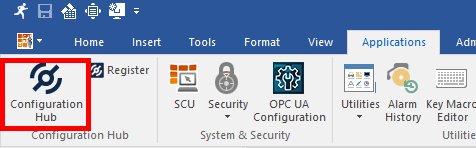
The Chrome browser should open with the Welcome screen displayed, as shown in the following figure.

- In the user name field, enter
ch_adminand then the password you entered for the client secret for the Proficy Authentication user when you installed the Common Components with the integrated Proficy installer. - Click Sign in. Configuration Hub screen appears.
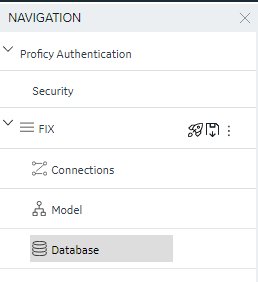
-
In the Navigation pane, select iFIX and then Database.
- Click the New button to add a new tag.
-
For the name, enter PUMP_STAT, and for the Tag Type select DI - Digital Input.
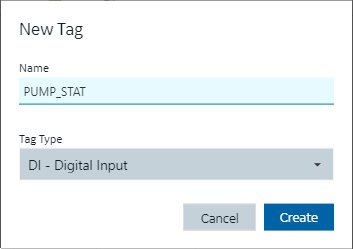
- Click Create.
- With PUMP_STAT selected, on the Details pane, set the I/O Driver to
IGS and the I/O Driver Address to Simulation
Examples.Functions.User3.

- Click Save to save your database changes.
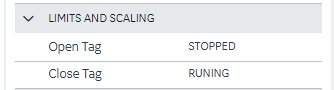
- With PUMP_STAT still selected, in the Limits and Scaling details, set Open Tag to
STOPPED and Close Tag to RUNNING.
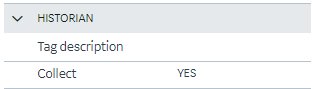
- With PUMP_STAT still selected, in the Historian details, set Collect to
YES.
- Click Save to save your database changes.
- Click the New button again to add the second new tag.
-
For the name, enter PUMP_SPEED, and for the Tag Type select AI - Analog Input.
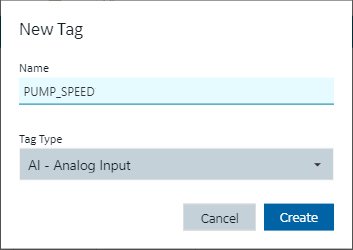
- Click Create.
- With PUMP_SPEED selected, on the Details pane, set the I/O Driver
to IGS and the I/O Driver Address to Simulation
Examples.Functions.User2.
- Click Save to save your database changes.
- With PUMP_SPEED still selected, in the Historian details, set
Collect to YES.
- Click Save to save your database changes.
- In the Navigation pane, click the Publish button to send your
local changes to the iFIX database.
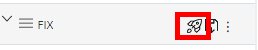
The Publish dialog box appears.
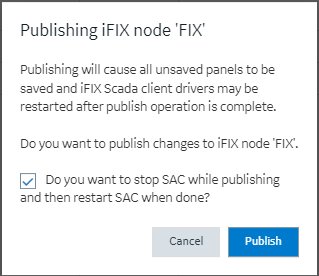
- Click the Publish button. A message box appears when the
publishing completes.
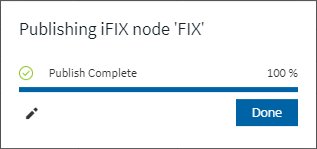
- Click Done. Now, you will be able to add these tags into an actual iFIX picture.
Add Two Datalinks to a Test Picture in the iFIX WorkSpace
The following steps describe how to add two Datalinks to a new picture in the WorkSpace so that you can test your IGS connections.
- With the default picture open in the iFIX WorkSpace, select Insert, Object/Links, and then Datalink Stamper.
-
Use the cursor to draw a box where you want the datalink to appear.
The Datalink dialog box appears, as shown in the following figure.
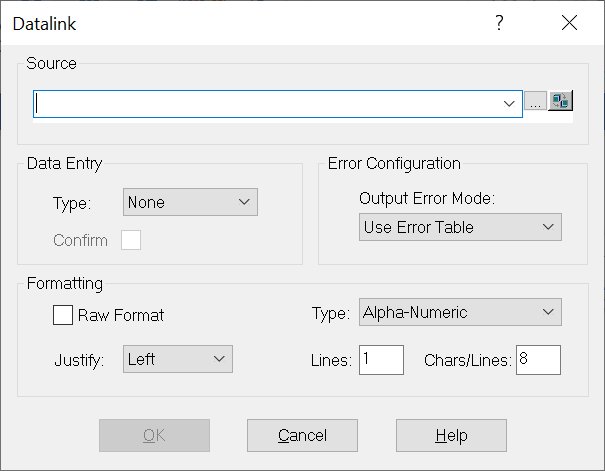
- In the Source field, enter Fix32.FIX.PUMP_STAT.A_CV, and click OK.
- Repeat steps 2-3 with the enter Fix32.FIX.PUMP_SPEED.F_CV tag, and click OK.
Add a Trend Chart to a Test Picture in the iFIX WorkSpace
The following steps describe how to add a Line Multiline chart to a new picture in the WorkSpace so that you can test your Historian connection.
- To insert a trend chart with a historical tag, from the iFIX WorkSpace, click the
Insert tab.
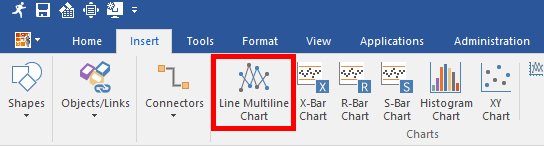
- Select Line Multiline Chart. The cursor again turns into a cross-hair.
- Draw a rectangle where you want the chart to appear in the picture.
- Double-click the chart. The Line Chart Customization dialog box appears.
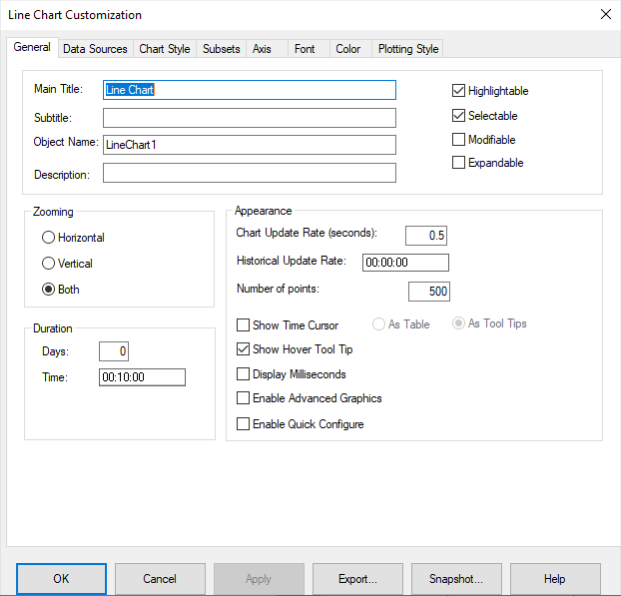
- On the General tab, set the Duration
Time to 10 minutes.Tip: If you want to see the line move on the chart when the picture appears in the run mode, try changing the Historical Update Rate to 5 seconds, for example. Otherwise, be aware that the chart will appear as a snapshot in time.
- Click the Data Sources tab.
- In the Data Sources area, click the button to add a data source.
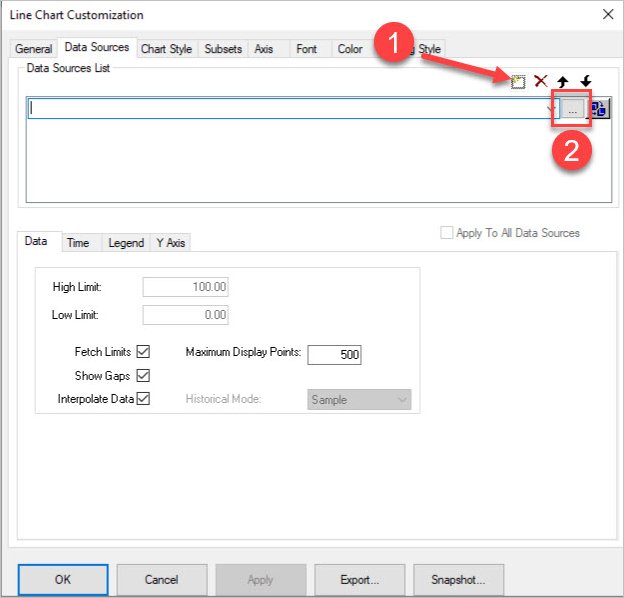
- Next, click the browse (…) button to open the Expression Builder.
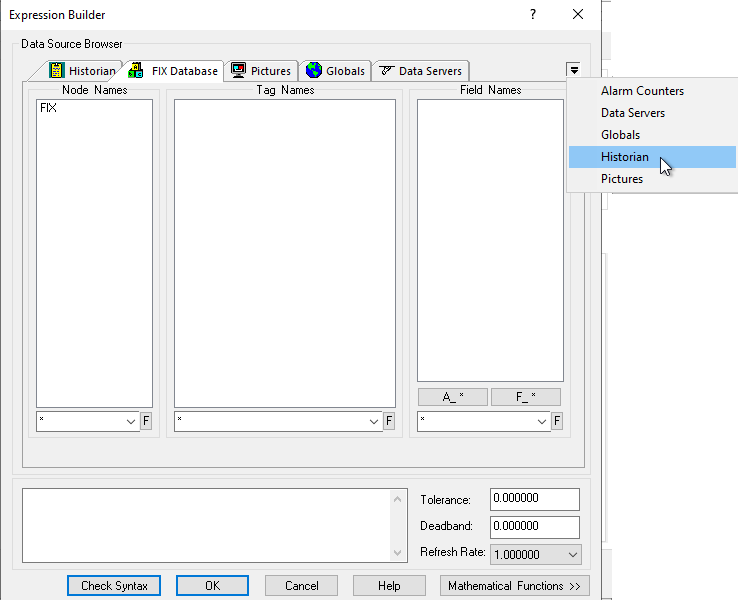
- From the Expression Builder, click the Historian tab. If it does
not show up, click the drop-down in the far right of the tab areas and select Historian
there.
- From the Servers drop-down list, select the Historian server name.
- Select the PUMP_SPEED.F_CV tag and then click OK.
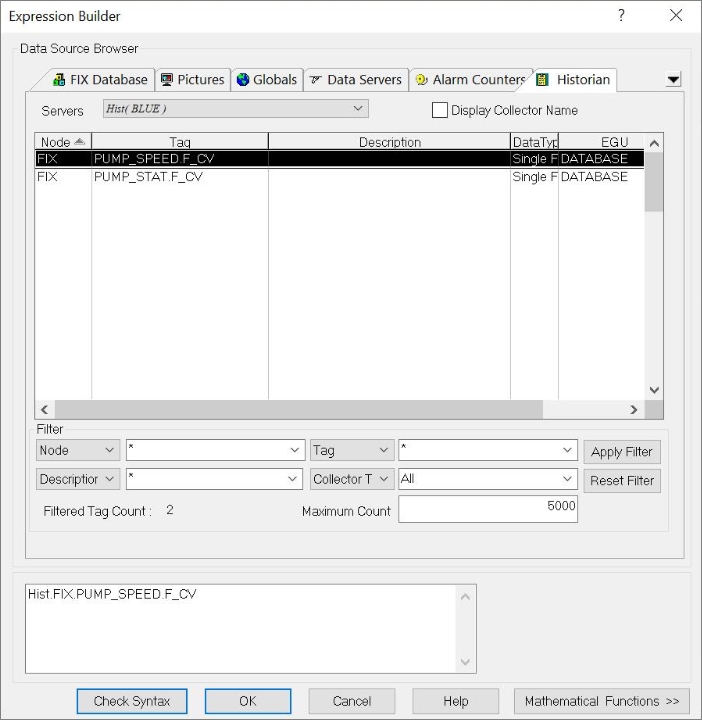
You will return to the Data Sources tab on Line Chart Customization dialog box, with the historical data source you just selected, appearing in the list.
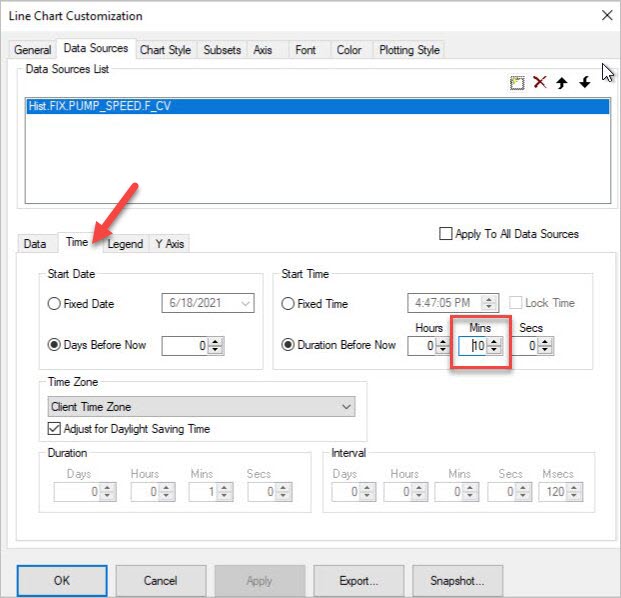
- With the data source selected, press Enter. (This releases the focus so that fields on the Time tab can be edited.)
- On the Data Sources tab, click the Time tab.
- In the Start Time area, change the Duration Before
Now to 10 minutes.
- Click OK to return to the iFIX picture.
- Press Ctrl+S to save your picture. From the dialog box that appears, provide a name for the picture and then click Save.
- On the Home tab, click Switch to run to confirm that you can view the real-time and historical data with changing values.
 Tip: Ctrl+W toggles between Configure and Run mode.The following example shows a picture in run mode with changing values.
Congratulations, you completed your quick start!
