Overview
Overview of the Alerts Module
The Predix Essentials Alerts module provides alerts from the sensors and analytics running in your facility.
When asset sensors send data to the system, the predictive analytics conduct threshold matching. When the data does not match the parameters set in the system, Predix Essentials generates an alert.
 : Displays the asset hierarchy.
 : Displays the pre-defined filter sets that you can use to filter the alerts. Additionally, the drop-down list provides the option to create custom filter sets. The filter set that is currently applied to filter the alerts along with the number of alerts that meet the filter criteria appear next to .
 : Displays the Alerts Preferences page that allows you to configure the preferences for visual layout of the details section in the Alert details page and the user interface of the Alerts module. You can set the preferences to re-order, collapse or expand and show or hide a section.
- Select
 for the required section and move up or down to a new position to change the order of the selected section. This allows you to control the order of the sections that appear on the Alerts Details page.
 - You can configure to show or hide the number of sections to appear on the Alerts Details page. In the SHOW SECTION column, select or unselect the check box for the section that you want to show or hide on the Alerts Details page.
- You can expand or collapse the sections to view or hide the information available for the individual sections. In theCOLLAPSE SECTION column, select the check box for a section that you want to view in collapsed mode in the Alert Details page.
- Select
- You can set the frequency at which you want to receive email notifications by selecting one of the following options provided for E-mail Frequency for alert activity:
- Every Change
- Hourly
- Daily
- Weekly
Note: Even if a value changes multiple times in the duration, only the latest value is included in the email notification.  : Refreshes the Alerts page to display the new alerts that match the applied filter set. By default, the Alerts queue is refreshed only when you select . However, you can enable auto-refresh for the view to be automatically refreshed in specific intervals by selecting the time interval in the drop-down list box next to . Disabling auto-refresh prevents new alerts from loading until you manually refresh the queue.Note: When you select an interval time to refresh the Alerts Inbox view and Alerts Grid view, your selection persists between both views so you can get the most recent results. Your filter and grid customizations also persist after refreshing.
 : Exports all alerts to a CSV file and downloads the CSV file to your local drive.
 : Displays the Create Alert window that allows you to create an alert.
 : Switches the view to Alerts Grid view which displays the alerts in a tabular format.Note: When you are in the Alerts Grid view, the button changes to
 and you can select this button to switch the view to Alerts Inbox view.
 Alerts Dashboard: Select the Alerts Dashboard link to open the Alerts Dashboard page in the Advanced Visualization module.
next to the filter name:- Unclaimed – Not yet assigned or claimed.
- All Alerts – All alerts in the database.
- Claimed – Assigned or claimed.
- In Process - Alert in In Process status.
- My Alerts – Claimed by you.
- SmartSignal – Available if SmartSignal is enabled.Note: This filter is not available in Predix Essentials
- More Filters – Can be used to create custom filters.
You can sort the queue by Time Received, Severity, or Alert Name. If you sort the inbox by Time Received, Severity, or Alert Name, the sorting persists when you switch to the Alerts Grid view. Once you have done the initial sort, you can sort by Ascending or Descending.
- Alert name, severity, and the number of latched alerts displayed in parentheses between the severity and alert name. If there are no latched alerts, then nothing displays between the severity and alert name.
- Incident count for SmartSignal next to the alert name.
- Date the alert was received.
- Status of the alert.
- Asset ID and site name.
An alert selected from the queue provides information about the alert and acts as a repository for notes and evidence pertaining to the issue.
About Alert Details Page
The Alert Details page displays all of the information about a given alert.
- By scrolling the Alert Details page.
- By selecting the icon corresponding to the section in the shortcut menu.

By default, the sections of the Alert Details page are expanded. However, you can collapse a section by selecting the heading of the section.
From the module navigation menu, you can directly open the other Predix Essentials modules to access any information.
If you are logged out of the Predix Essentials application, you need to log in to the application before accessing the email alert notification to navigate directly to the Alert details page.
- Alert Header
-
Contains basic information about the alert:
- Alert name, severity, and latched alert count – If the alert is latched, the number of grouped alerts appears in parentheses between the severity and alert name. Select
 to display a tooltip with an alert description. You can change the alert template from this tooltip.
 - Date and time for receipt of the alert.
- Alert status and disposition. The Disposition drop-down list for the alert appears when a claimed alert has a Ready or In Process status. If the alert has already been processed, the page displays the previously selected disposition.
- Alert type.
- The Limited Visibility Alert icon (
 ) – Toggle the icon to change the alert visibility from limited to general. When visibility is set to General, the icon changes to the General Visibility Alert icon (
 ).
). - The Refresh button (
 ) – Refreshes the Alert Details page.
 - The Unsubscribed/Subscribed icon – By default, the alert displays a status of Unsubscribed (
 ), but toggling it changes it to Subscribed (
 ).
). - The Timeline View button – when selected, shows a list of actions taken chronologically (with latest action on top) for that alert, instead of the alert sections. Select Section View to revert to the default view of the alert, showing all of the sections.
- A Claim Alert, Claim Advisory, or Reopen button, based on the status of the alert.
- The Create Case button. This appears when you have claimed an alert and it is in the Ready or In Process state.
- Actions menu (
 ), where you can release a claim, assign an alert, mark the alert as processed, navigate to an external link, perform maintenance, defer alert, dismiss deferred alert, or export the alert to a PDF file.
- Alert name, severity, and latched alert count – If the alert is latched, the number of grouped alerts appears in parentheses between the severity and alert name. Select
- ALERT INFORMATION
- In the shortcut menu, the ALERT INFORMATION section is represented by . This section contains the following information on the alert and the asset associated with the alert:
- Alert ID
- Timestamps of the first and last occurrences of the alert. In case of latched alerts, these values indicate the first and last occurrences of the latched alerts and in case of SmartSignal alerts, these values indicate the last processed and last observation timestamps of the alerts.
- Name of the owner of the alert
- Source of the alert
- Link to the analytic instance associated with the alert
- Alert model name. Name of the contributing model for the Alert.Note: This is applicable only for the SmartSignal alerts.
- Asset ID
- Asset name
- Asset criticality number. You can select the criticality number to view the Criticality Analysis page that offers details on the justification level of the criticality for the primary asset related to this alert.Note: This feature is not available in Predix Essentials.
- Density of the alert. The Density value appears only for SmartSignal and SmartSignal Tag Rule alerts.
- Site name
- Links to the different levels of the asset hierarchy associated with the alert
- Analytic model name
- SCAN GROUP DATA
- In the shortcut menu, the SCAN GROUP DATA section is represented by
 . This section provides tag names and values for the tags that contributed to the alert.
 - ANALYSIS
- In the shortcut menu, the ANALYSIS section is represented by
 . This section lists the available analysis views for the alert, and provides a link to the associated alert analysis chart on the Analysis page. Accessing the link opens the template in a new browser tab. For Predix Essentials, accessing an analysis template link in the Alerts Details page causes the analysis template to be shown in the Meridium tab. Additionally, for SmartSignal alerts, this section contains a link to the Event Frame Analysis view of the SmartSignal chart that is associated with the alert.
 - INTERNAL NOTES
- In the shortcut menu, the INTERNAL NOTES section is represented by
 . This section only appears if you have either View Internal Notes or Manage Internal Notes permissions. These notes do not appear in the Alert Detail grid view, nor can they be exported via PDF.Note: You can select
 for a note to delete it from this section.
 - NOTES
- In the shortcut menu, the NOTES section is represented by . You can use this section to read and add public notes related to the alert. These notes are viewable in the Alert Detail grid view and can be exported via PDF.
- ASSET INFORMATION
- In the shortcut menu, the ASSET INFORMATION section is represented by
 . This section lists the name of custom attributes and their values for the asset associated with the alert. If there are no custom attributes available for the asset, the section will not contain any data. Additionally, you can hide the custom attributes for which no value is configured by selecting the Hide empty values check box.
 You can export this section to a PDF file. If the Hide empty values is selected, the attributes that do not contain a value are not exported.
- INTERNAL LINKS
- In the shortcut menu, the INTERNAL LINKS section is represented by
 . This section lists the links to other internal sections, such as Analysis. This section appears in Alert Details page only if the associated alert template has the section.
 - LINKED CASES
- In the shortcut menu, the LINKED CASES section is represented by
 . This section displays a list of cases created by the alert. You can select to link a case to the alert.
 - EVIDENCE
- In the shortcut menu, the EVIDENCE section is represented by
 . You can use this section to upload images and documents related to the diagnosis of the issue. You also can view saved alert-analysis charts. You can select to upload new files related to the alert.
 - QUALITY AUDIT
- In the shortcut menu, the QUALITY AUDIT section is represented by
 . You can use this section to perform a quality audit on a processed alert after analyzing whether the disposition and processing of the alert was correctly done.Note: This section appears only for processed alerts.
 - RECOMMENDATION
-
Note: This feature is not available in Predix Essentials.
- In the shortcut menu, the RECOMMENDATION section is represented by
 . In this section, you can create a recommendation to propose a course of action to fix the problem that the alert has indicated.
 - New Recommendation creation from an alert – To create a new recommendation, select
 to open the Record Manager tab, which displays an Alert datasheet that you will need to complete.
 - WORK HISTORY
- Note: This feature is not available in Predix Essentials.In the shortcut menu, the WORK HISTORY section is represented by. In this section, you can view work orders from the Alert Details page to understand the details of the work being done to resolve the issue that the alert has indicated. The following precondition must be met:
- The same asset data must be available and mapped in both the Predix Essentials and Meridium systems.
About Alert Severity and Status
Alert Severity
Each alert displays a colored box containing a number, both of which reflect the severity of the alert.
| Color | Severity level |
|---|---|
| Dark Red | 1 |
| Red | 2 |
| Orange | 3 |
| Pale Orange | 4 |
| Yellow | 5 |
| Blue | 6 |
SmartSignal advisories display an incident-event count in parentheses to the left of the alert name.
Alert Status
The following table shows the possible alert statuses and the corresponding status indicators:
| Status | Indicator | Description |
|---|---|---|
| Ready |  | Alert is ready to be claimed. |
| In Process |  | Alert has an owner. |
| Processed |  | Alert has been marked as processed. |
| In Process Escalated |  | Alert has been escalated. |
| In Process Maintenance |  | Analytic associated with the alert is in maintenance. |
About Alert Timeline View
The timeline view of an alert shows the history of the alert, letting you know who made changes to the alert and when the changes were made.
- When an alert was created.
- When the alert is claimed.
- When the alert state is changed, for example, Marked as Processed, or Reopened Alert.
- When the alert template is changed.
- When a Note is added to or deleted from the alert. In the Timeline view, you can select the horizontal arrow (
 ) to the left of the Note to view the contents of the note.
 - When the alert disposition is changed, for example, Valid or False.
- When evidence is added to or deleted from an alert.
- When a case is created from the alert, and who created the case.
- When an alert is linked to or unlinked from a case.
- When the visible state of an alert is changed.
To return to the section view, in the details page of the alert, select the Section View button.
About Alert Visibility
The limited visibility alert icon is present in the Alert Details page, and is grayed out by default.
All new alerts are designated as "Limited Visibility Alerts" by default. If any asset for which you have permissions has its alerts specified as "Limited Visibility", then you have limited visibility permissions for that asset. If you have permissions to view limited visibility alerts, then, when you are logged in to Predix Essentials, you will see both limited visibility alerts and general visibility alerts.
When you hover over the grayed-out icon, a "Set Visibility to General" message appears. If you have limited visibility permissions for Alerts and permissions to manage alerts, then you can change the visibility factor for an alert by selecting the limited visibility alert icon (![]() ), which changes the alert icon to (
), which changes the alert icon to (![]() ), meaning that the alert now has general visibility and can be seen by anyone with permissions to view alerts. When you hover over the general visibility icon, a "Set Visibility to Limited" message appears. Selecting the icon returns the visibility of the alert back to limited visibility.
), meaning that the alert now has general visibility and can be seen by anyone with permissions to view alerts. When you hover over the general visibility icon, a "Set Visibility to Limited" message appears. Selecting the icon returns the visibility of the alert back to limited visibility.
If you have access to the Alert Timeline View, then when an alert is set as "Visible to All", in the timeline view you can see who changed the visibility for the alert and when the change was made. Likewise, when the alert visibility is changed to "Limited", in the timeline view you can see that the visibility was changed to "Limited" as well as who changed the visibility and the time stamp for the change.
About Alert Notification
When an alert to which you have subscribed is updated by another user, you will receive an email notification about the change.
- When a user updates an alert that belongs to another tenant, you will not receive any email notification about the change even though you have subscribed to the alert.
- When you lose access to an asset, you lose subscription to the alerts for that asset to which you had previously subscribed.
- When you release an alert, you automatically lose subscription to that alert and stop receiving notifications about any changes made to the alert.
- Every Change
- Hourly
- Daily
- Weekly
- In the email subject line, the name of the Customer or User information
- The ALERT INFORMATION section: Displays the following information on the alert and the asset associated with the alert:
- Alert ID
- The date and time when the alert occurredNote: In the email notification, the date and time appear based on the time zone set in the My Preferences page.
- Name of the owner of the alert
- Source of the alert
- ID of the asset associated with the alert
- Name of the asset associated with the alert
- Name of the site
- The default analysis charts in the ANALYSIS section for SmartSignal alerts
- The SCAN GROUP DATA section: Displays tag names and values for the tags that contribute to the alert.Note: This section does not appear for the following activities triggering the email notifications:
- Attachment Added
- Attachment Deleted
- Note Added
- Note Deleted
An email notification is not sent for the alerts whose template property is set to not Consumable.
| Activity (that Triggers Notification) | Email Notification Details |
|---|---|
| Alert Assigned | Alert assigned to <User First Name> <User Last Name> |
| Alert Claimed | No additional detail |
| Alert Template Updated | Alert Template updated from <original alert template name> to <current alert template name> |
| Disposition Updated | Disposition updated from <Original Value> to <Current Value> |
| Claim Released | No additional detail |
| Marked as Processed | No additional detail |
| Alert Marked as Processed by Auto Close | Alert <Alert ID>:<Alert Name> Template Mark as Processed by AutoClose Action in Case <Date with Timestamp> - <Username> |
| Alert Reopened | No additional detail |
| Note Added | The note text is displayed in the NOTES UPDATE section. |
| Note Deleted | The note text is displayed in the NOTES UPDATE section. |
| Attachment Added | The name of the attachment is displayed in the EVIDENCE UPDATE section. |
| Attachment Deleted | The name of the attachment is displayed in the EVIDENCE UPDATE section. |
| Alert Severity Updated | The change in the severity of an Alert is updated. |
About Alert Subscription
Subscribing to an alert causes you to be notified when there are any changes to the alert.
You can subscribe to an alert by selecting the grayed-out Unsubscribed icon () in the Alert Details page. Hovering over the icon displays the text "Subscribe to this alert". Once you are subscribed, the icon changes to the Subscribed icon (![]() ), which means that you will receive email notifications for changes to that alert. Hovering over the Subscribed icon displays the text "Unsubscribe from this alert". Selecting the icon again will unsubscribe you from the alert.
), which means that you will receive email notifications for changes to that alert. Hovering over the Subscribed icon displays the text "Unsubscribe from this alert". Selecting the icon again will unsubscribe you from the alert.
Whenever you claim an alert, you are automatically subscribed to that alert, and will receive email notification when subsequent changes are made to the alert. The notification will also indicate by whom the changes were made. However, if you do not want to receive email notifications for an alert that you want to claim, you must clear the Subscribe me to alert notifications when I claim ownership check box in the Notification Preference window that appears when you select in the Alerts page.
- When you lose access to an asset, then you lose subscription to the alerts for that asset if you had previously subscribed to alerts for that asset.
- When you release an alert, you automatically lose subscription to that alert.
About Alert Escalation and De-escalation
Escalation and de-escalation of an alert indicates the significance of the alert, which helps you prioritize the alert for processing. Alert escalation and de-escalation are applicable only to latched alerts, and the status of an alert changes based on the change in severity.
The following table describes the alert escalation and de-escalation indicators based on the severity change.
| Change in Alert Severity | Escalation Status | Indicator |
|---|---|---|
| No change in severity | No change |  |
| Increase in severity | Escalated | |
| Decrease in severity | De-escalated |
Example of Alert Escalation and De-escalation for an Unclaimed Alert in the Ready State
The following diagram illustrates an example of the alert escalation and de-escalation based on the change in severity for an unclaimed alert, which is in the Ready state.
Consider a scenario where an alert occurs four times for the same asset with different severity.
The first occurrence of an alert is the initial alert for an asset. The alert is in the Ready state.
If the second occurrence of the alert for the asset has a severity higher than the initial alert, the initial alert displays ![]() with its name to indicate that the alert is escalated.
with its name to indicate that the alert is escalated.
If the third occurrence of the alert for the asset has the same severity as the severity of the alert in second occurrence, the initial alert displays with its name to indicate that there is no change in severity.
If the fourth occurrence of the alert for the asset has the severity lower than the severity of the alert in third occurrence, the initial alert displays ![]() with its name to indicate that the alert is de-escalated.
with its name to indicate that the alert is de-escalated.
Example of Alert Escalation and De-escalation for Claimed Alert that is in In Process State
The following diagram illustrates an example of the alert escalation and de-escalation based on the change in severity for a claimed alert, which is in the In Process state.
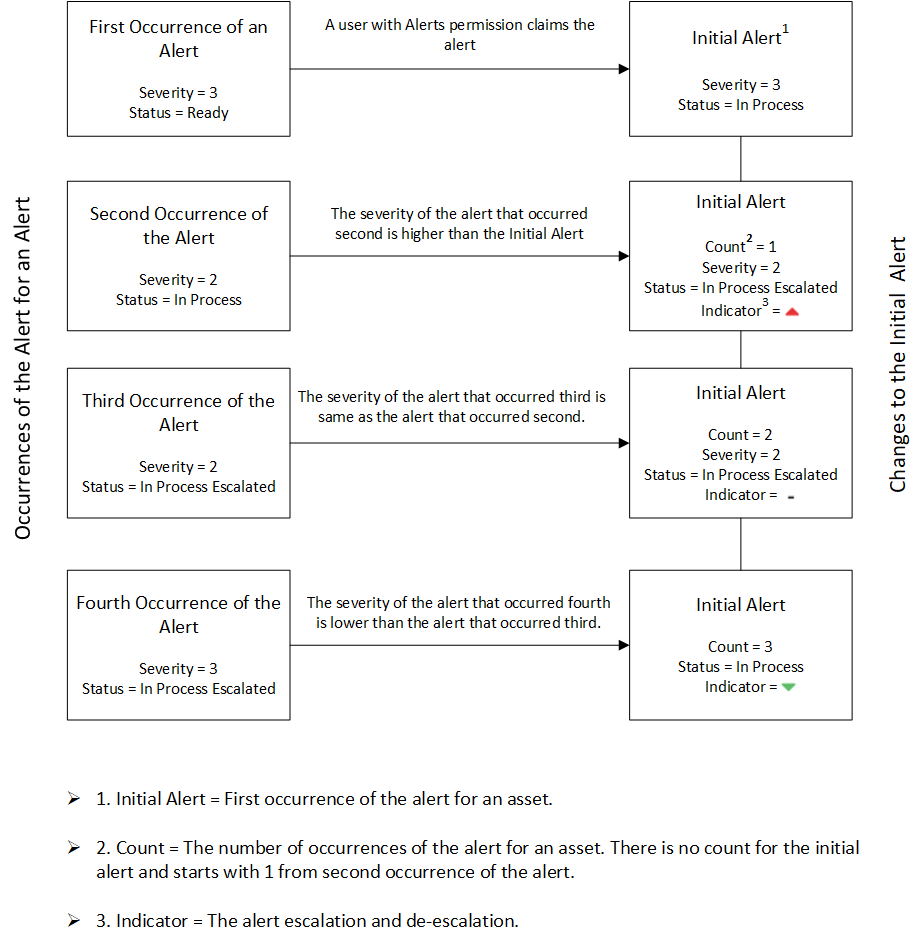
The first occurrence of an alert is the initial alert for an asset. When you claim the alert, the state changes from Ready to In Process.
- The state of the initial alert changes to In Process Escalated.
- The initial alert displays
 with its name to indicate that the alert is escalated.
- The state of the initial alert will remain as In Process Escalated.
- The initial alert displays with its name to indicate that there is no change in severity.
- The state of the initial alert changes to In Process.
- The initial alert displays
 with its name to indicate that the alert is de-escalated.
About SmartSignal Analytic Instance for Maintenance
Performing maintenance is the process of selecting an analytic instance associated with a SmartSignal alert for maintenance and retraining the analytic instance. You can select the SmartSignal analytic instance from the Alerts application independent of the SmartSignal application.
When you select Perform Maintenance for an alert, the status of the alert changes to In Process Maintenance, which signifies that the alert was generated because the analytic instance did not accurately reflect the current operating state. Therefore, you can select the analytic instance associated with the alert for maintenance and retrain the analytic instance.
- The Alerts or Manage Alerts permission to change the status of the alert to In Process Maintenance.Note: You can change the status of an alert other than a SmartSignal alert to In Process Maintenance. However, you cannot access the analytic instance for the alert.
- The SmartSignal Mapping permission to modify an analytic instance of a SmartSignal alert. For more information on SmartSignal permissions, refer to Default Permission Set Definitions in the Users and Permissions documentation.