
The Mechanical Availability Metric View illustrates for a single production unit how much time the unit was available for production and not down for one of the following reasons:
Turnaround Down Day
Routine Maintenance Down Day
Routine Maintenance Slowdown Day
Each level of the Metric View displays a percentage of available time using the following equation:
...where:
Time is the number of days for which the production data exists.
Short Range Plan is the Short Range Plan value for any day for which the production data exists.
Note: If a production unit produces more than one product, where each of those products has its own Short Range Plan values, the sum of those Short Range Plan values is used in the equation. This is illustrated in the example following this list.
TADD is the amount of production that was lost due to a Turnaround Down Days (i.e., the Impact Code is TADD).
RMDD is the amount of production that was lost due to a Routine Maintenance Down Day (i.e., the Impact Code is RMDD).
RMSD is the amount of production that was lost due to a Routine Maintenance Slowdown Day (i.e., the Impact Code is RMSD).
Note: If you have created custom impact codes to categorize your data, you will need to modify the calculation for the Mechanical Availability Metric View in the Production Data cube in SQL Server Analysis Services. Instructions for completing this task are not provided in the Meridium APM Documentation. For more information, consult your Microsoft documentation.
For example, assume that for Unit 1:
Production data exists for January 1 through January 10. So, time is 10 (ten days).
Unit 1 produced both bottles and labels during those ten days.
Unit 1 can produce 5,000 bottles per day and 8,000 labels per day.
Within the ten days, 24,500 bottles and labels were not produced as a result of Turnaround Down Days.
Within the ten days, 8,200 bottles and labels were not produced as a result of Routine Maintenance Down Days.
Within the ten days, 19,500 bottles and labels were not produced as a result of Routine Maintenance Slowdown Days.
Using this data, Mechanical Availability is calculated using the following values:
Time = 10
Short Range Plan = 13,000 (i.e., 5,000 + 8,000)
TADD = 24,500
RMDD = 8,200
RMSD = 19,500
Remember that Mechanical Availability is calculated as:
...so:
Mechanical Availability = (10 x 13,000 - [24,500 + 8,200 + 19,500] / [10 x 13,000]) x 100
Mechanical Availability = ([130,000 - 52,200] / 130,000) x 100
Mechanical Availability = (77,800 / 130,000) x 100
Mechanical Availability = .59846 x 100
Mechanical Availability = 59.85%
In this case, if you were to view the Mechanical Availability Metric View for Unit 1, the level that displays Mechanical Availability for January would look like this, where the month of January is displayed on the x-axis, and the mechanical availability is displayed on the y-axis as a percentage:
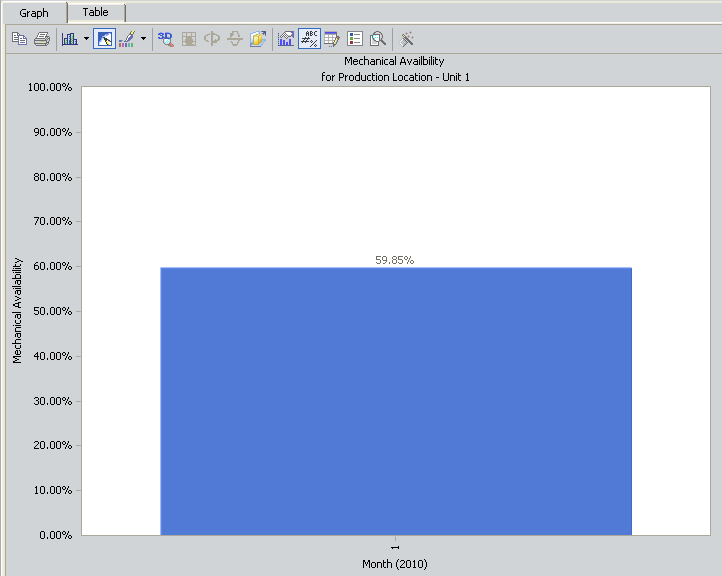
In other words, from January 1 through January 10, Unit 1 operated 59.85% of the time without experiencing a Turnaround Down Day, Routine Maintenance Down Day, or Routine Maintenance Slowdown Day.
If you were to drill down into the next level of the graph, you would see this:
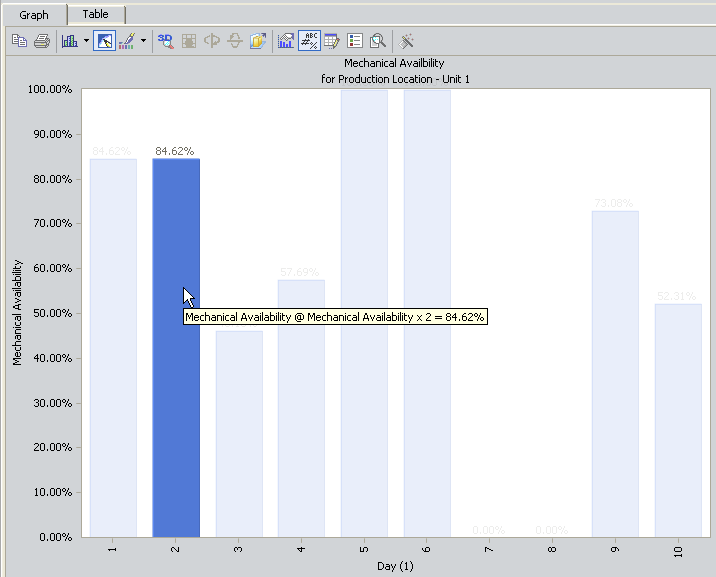
Here, you can see that for day 2 (January 2), Unit 1 was available 84.62% of the day without experiencing a Turnaround Down Day, Routine Maintenance Down Day, or Routine Maintenance Slowdown Day. This value is calculated using the following values.
|
Product |
Date |
MSCR |
Loss |
Impact Code |
|---|---|---|---|---|
|
Bottles |
1/2/2010 |
5000 |
2000 |
RMSD |
|
Labels |
1/2/2010 |
8000 |
3000 |
RPSD |
Using these values, for January 2:
Time = 1 day
Short Range Plan = 13,000 (5,000 + 8,000)
TADD = 0
RMDD = 0
RMSD = 2,000
...Mechanical Availability is calculated as:
Mechanical Availability = ([1 x 13,000 - 2,000] / [1 x 13,000]) x 100
Mechanical Availability = .84615 x 100
Mechanical Availability = 84.62%
Copyright © 2017 General Electric Company. All rights reserved.