
Consider the following example, which explains how to create two ACA Analyses, where:
One analysis, Analysis A, contains one system with three Equipment records.
The other analysis, Analysis B, contains one system with two Equipment records and one Functional Location record.
The following information explains how the Excel file would be structured to produce these results.
Note: The yellow and blue shading has been added to the images for clarity. The shading is not available in the example Excel file.
The Microsoft Excel file contains an Analyses worksheet, similar to the one shown in the following image.
From this worksheet, you can see that two Analysis IDs are listed: Analysis A and Analysis B.
You can also see the following values in the Site ID column:
Roanoke, VA
Houston, TX
You can assume, therefore, that the database into which this file will be imported contains two Site Reference records whose Name field contains the value Roanoke, VA and Houston, TX. These records are illustrated in the following images.
Roanoke, VA Site Reference record

Houston, TX Site Reference record

The Microsoft Excel file also contains a Systems worksheet, similar to the one shown in the following images (separate image are provided to make the columns easier to see).

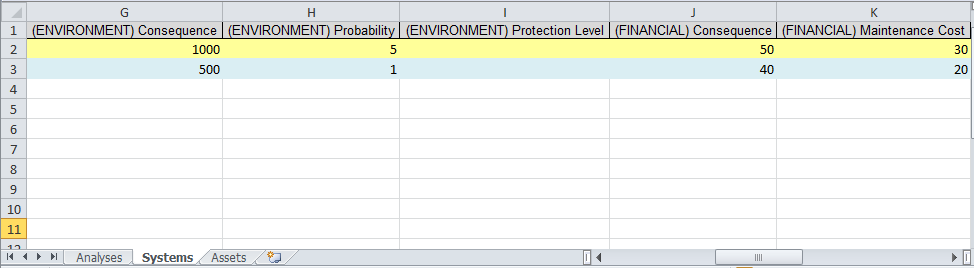


In the Microsoft Excel file:
The yellow row represents the Asset Criticality Analysis System record System 101, which will be included in Analysis A.
The blue row represents the Asset Criticality Analysis System record System 102, which will be included in Analysis B.
Starting in column G, (ENVIRONMENT) Consequence, you can see the risk rank values that will be mapped to the Risk Matrix (stored in Risk Rank records) that will be displayed when you access it from the context of the Asset Criticality Analysis System record (on the Asset Criticality Analysis Systems page).
The Microsoft Excel file also contains the Assets worksheet, similar to the one shown in the following image (separate images are provided to make the columns easier to see).

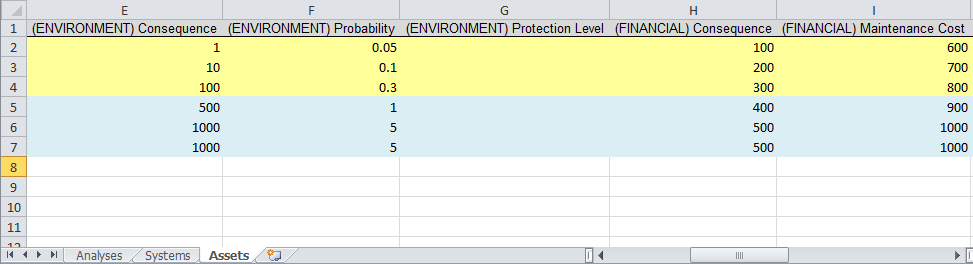


In the Microsoft Excel file:
The yellow rows represent the Equipment or Functional Location records that will be linked to the Asset Criticality Analysis System record System 101. Because all of the yellow rows contain the value MI_EQIUP000 in the Asset Family ID cell, you can determine that the values in the Asset ID cells in those rows represent existing Equipment records.
The blue rows represent the Equipment or Functional Location records that will be linked to the Asset Criticality Analysis System record System 102. You can see that two of the blue rows contain the value MI_EQIUP000 in the Asset Family ID cell, and one of the blue rows contains the value MI_FNCLOC00 in the Asset Family ID cell. The rows with the value MI_EQIUP000 represent existing Equipment records, and the row with the value MI_FNCLOC00 represents an existing Functional Location record.
Starting in column G, (ENVIRONMENT) Consequence, you can see the risk rank values that will be mapped to the Risk Matrix (stored in Risk Rank records) that will be displayed when you access it from the context of the Equipment or Functional Location records (on the Asset Criticality Analysis Systems page).