In the upper-right corner, select New Analysis, and then select Production Analysis.
The Production Analysis Builder appears.

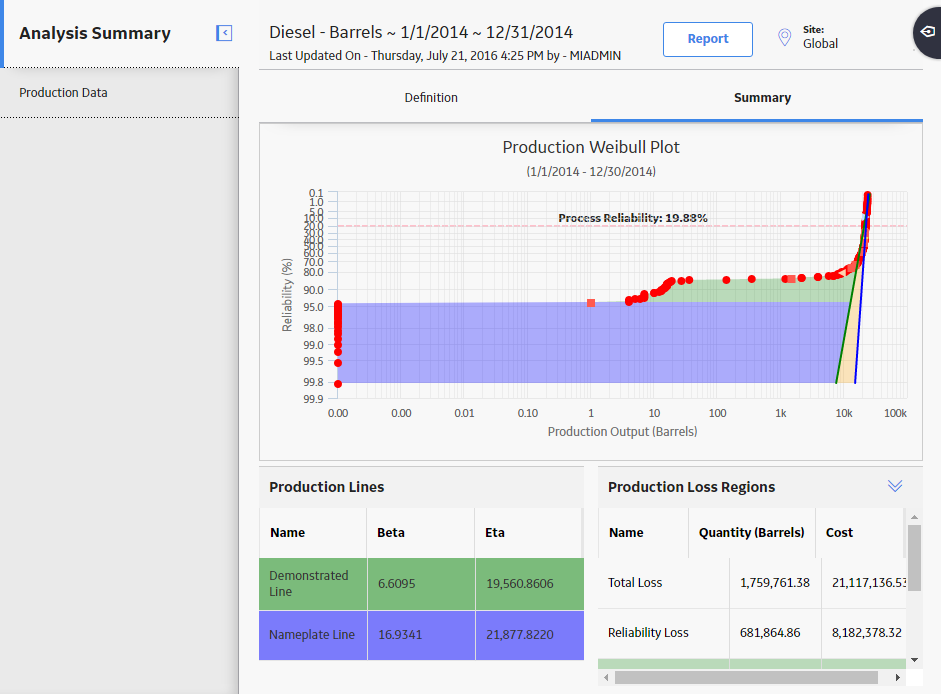
Note: All required information is provided, but for additional information, consult the Production Analysis topic.
Enter values in the Analysis Name and Description fields for the new analysis, and then select Next.
The Select Data Source Type screen appears.

Select I will manually enter data, and then select Finish.
The Production Data Editor window appears, displaying a blank grid.
![]()
Select
A new row appears.
Enter the information in the following fields:
-
Production Output: Enter the first production output value. This field is required.
Note: If you do not have any data for a given date, you must type 0 (zero). If you enter a null value, it will be converted to the minimum selected value.
- Date: Select or enter a date associated with the first production output value. This is field is optional.
- Ignore: Select the check box if you want to exclude this output value from calculations performed by the Production Analysis. The datapoint will be plotted but will be displayed as an X.
-
Note: You can add more rows of data by selecting
at the top of the Production Data Editor window. You can remove any row of data by selecting the row, and then selecting .
Select OK.
The Production Data Editor window closes.
If you entered zeros or negative numbers for the Production Output values, the Set Minimum Production Output window appears.

In the Minimum Production Output box, enter the value that you want to use to replace zero and negative production output values. The suggested value is calculated based on the highest production output. Zero and negative values cannot be plotted and will instead be plotted using the value specified here. You can also change the Minimum Production value after the Production Analysis has been created.
Note: To determine the suggested value, 0.00001 is multiplied by the highest production output value and then rounded up. For example, if the highest production output value is 823, that value is multiplied by .00001 to equal .00823. That value is then rounded up to one at the first non-zero decimal place, or .001 in this example, to become the default value in the Minimum Production Output box.
Select OK.
The Production Analysis page appears, displaying the results of the analysis.