Select the Production Analyses tab.
A list of Production Analyses available in the database appears.
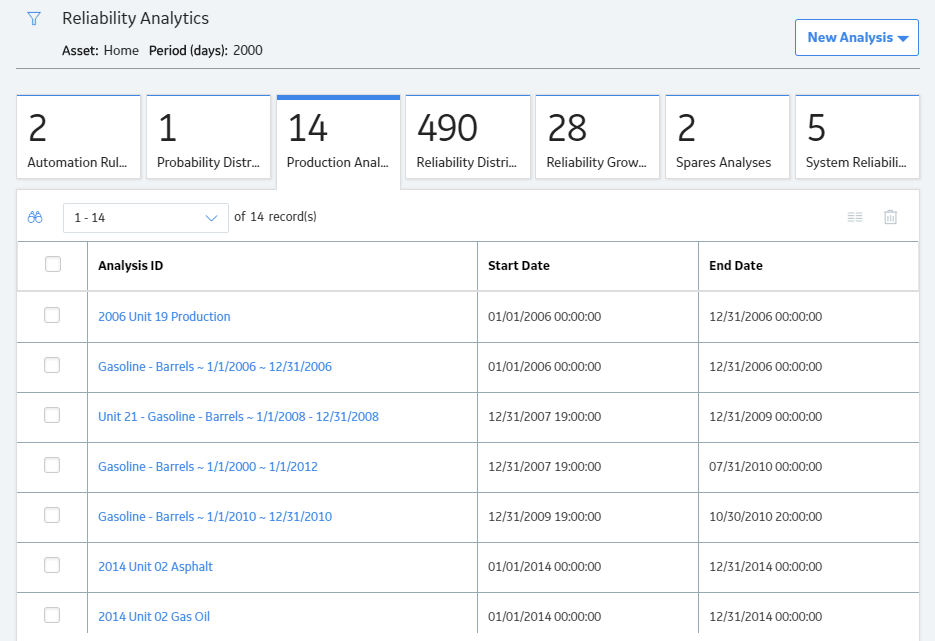
Select the Production Analysis whose details you want to view.
The Analysis Summary workspace for the selected analysis appears, displaying the following tabs:
- Definition: Displays the details of the selected Production Analysis.
- Summary: This tab is selected by default and contains the following information:
- Production Data Plot: Contains a plot based on the production output values. The range of dates that the datapoints represent is displayed above the plot.
- Production Lines: Contains a grid that shows a row for each Production Line, displaying its Beta and Eta values in the Production Data Plot.
-
Production Loss Regions: Contains a grid that displays the results of the cost calculations for each specified loss region.
Tip: You can hide the Production Lines and Loss Regions panes by selecting
. You can also view them in full screen by selecting .
The left pane contains the following tab:
- Production Data: Contains the Production Data Plot.
