CIMPLICITY
4. SPC Runtime: Exclusion Mode
A process must be in control when you determine its control limits. Some values (e.g. values collected when a machine is warming up or when a cutter is being recalibrated) contaminate the results. CIMPLICITY SPC includes the Exclusion mode so those values can be excluded from the calculations.
SPC Exclusion Mode is enabled on the following chart types:
| Variable | Attribute |
|---|---|
| XBar-R | P |
| XBar-S | nP |
| C | |
| U |
| 1 | Detect explained erratic values. |
| 2 | Enable exclusion mode. |
| 3 | Exclude values. |
Detect Explained Erratic Values
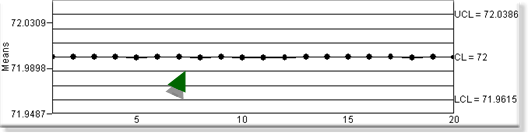
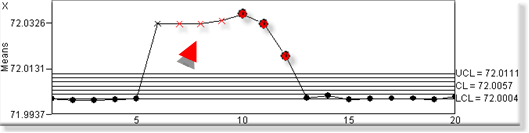
A chart with normally consistent values can show deviations for known reasons (e.g. a cutter was being re-calibrated while product was being cut and finished.

| 1 | Charts report values that deviate from the targeted product length of 72 inches. |
| 2 | Auto-calculated means and upper/lower sample values. |
| 3 | UCL/CL/LCL values are were entered in the variable's Variable Quality Characteristics Properties dialog box>Limits tab. |
Enable Exclusion Mode
- Right-click the mouse a chart
- Select Exclusion Mode on the Popup menu.
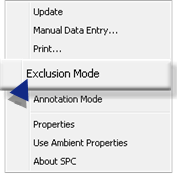
Result: The chart goes into Exclusion mode; the ability to exclude values is enabled.
Exclude Values
When values that are normally consistent deviate from the norm for known reasons, they can be excluded from SPC calculations.
Example
Values on a chart that are normally flat increase in value; the change is known to be a temporary machine adjustment.
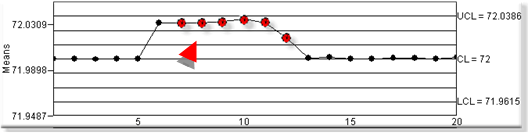
The chart is put into Exclusion mode.
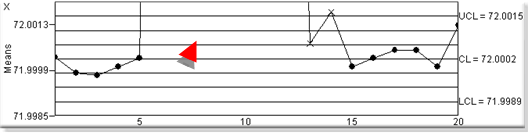
Note: An X in the upper-left corner indicates that the chart is in Exclusion mode.
An X replaces the value. The X will be red if the value has failed one or more tests.
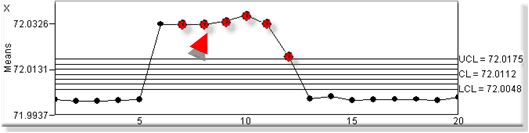
The X'd values are not included in the calculation; they may go beyond the new chart limits.
As the chart runs in Exclusion mode additional values may be X'd out.
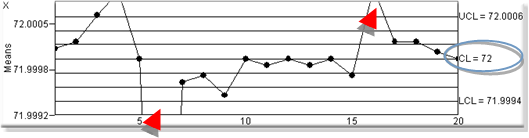
Once you leave Exclusion mode and return the previously excluded values are again included in the sampling/calculations.
If the out of control values were a temporary, known reason, the process will again be in control.