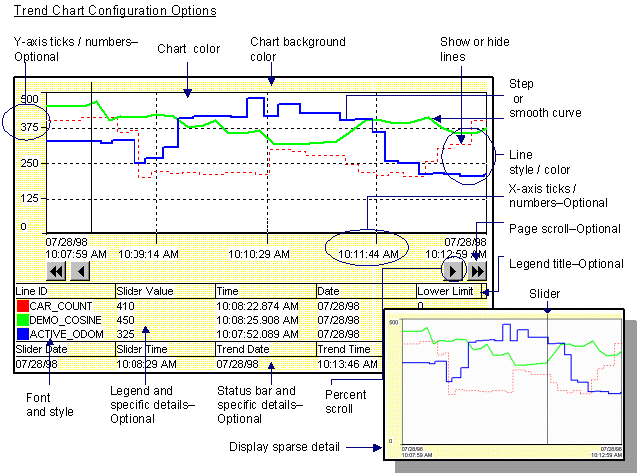
Trend Chart Display
You have considerable control over what your trend control chart displays and its appearance.
For information, you can:
- Create a trend chart that displays:
- Only the trend lines you choose to display
- Minimum detail so a user can quickly view static values from a data source, based on time
- All the details a user needs to fully analyze any of the trend lines
- Allow a runtime user, for the one runtime session, specify what
- Lines should display
- Details should display
For display, you can choose the colors; line types and fonts that you think will work best. You can also let a runtime user make changes during their runtime session.


