 CIMPLICITY
SPC Charts: Variables
Variable charts track and report the fluctuations of a particular process to help determine if the process is stable (in control).
- Chart: Individual
- Chart: Histogram
- Chart: XBar-S
- Chart: XBar-R
- Chart: (Simple) Moving Average
- Chart: Moving Range
- Chart: Exponentially Weighted Moving Average (EWMA)
- Chart: Report
Chart: Individual
X-Individual charts:
| Track | Individual values |
| Report | Individual values over time. |
Note: The control limits are calculated by determine the standard deviation of the sample population.
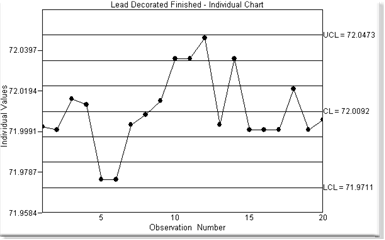
The Individual chart is selected on the SPC Control Properties dialog box>Chart tab.
Chart: Histogram
Histogram charts:
| Track | Individual values over a selected time period. |
| Report | Distribution and other statistics based on the individual values. |
A Histogram chart displays the following.:
- Sample data.
- Distribution
- Central tendency
- Scatter or variability
- Data
- Calculated process capability.
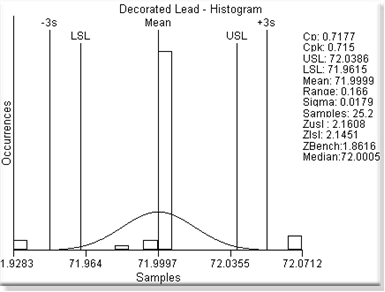
- Depending on whether the source of the data is an XBar-R or XBar-S chart, the estimate of the process standard deviation differs.
- When arranged from lowest to highest; if the number of values is even, by convention the average of the middle two values is use.
- The histogram is selected on the SPC Control Properties dialog box>Chart tab.
Chart: XBar-S
XBar-S charts:
| Track | Selected characteristic value of each unit in a subgroup. | |
| Report | XBar | Subgroup means over time. Control limits are calculated using the average standard deviation. |
| Sigma | Subgroup standard deviation over time. | |
XBar-S subgroup is:
- Variable in size.
- Relatively large.
- Collected at regular intervals.
- Common with other subgroups in one or more features.
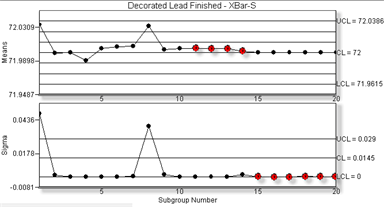
Notes
- The XBar-S chart is selected on the:
- Variable Quality Characteristics Properties dialog box>General tab.
- SPC Control Properties dialog box>Chart tab.
- Control tests are available for the XBar-S chart.
Chart: XBar-R
XBar-R charts
| Track | Selected characteristic value of each unit in a subgroup. | |
| Report | XBar | Subgroup means over time. Control limits are calculated using the average standard deviation. |
| Range | Ranges within the subgroups. | |
XBar-R subgroup is:
- The same size.
- At regular collection intervals
- Common with other subgroups in one or more features.
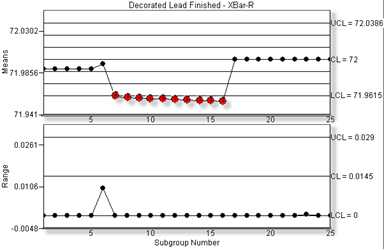
Notes
- The XBar-R chart is selected on the:
- Variable Quality Characteristics Properties dialog box>General tab.
- SPC Control Properties dialog box>Chart tab.
- Control tests are available for the XBar-R chart.
Chart: (Simple) Moving Average
Moving Average charts:
| Track | Selected characteristic value of each unit in a fixed subset. |
| Report | Average for the first fixed subset and then the average of the rolling subset. Note: SPC drops the first value in the existing subset; picks up the next value after the existing subset. |
Moving Average observation is a rolling, fixed size subset.
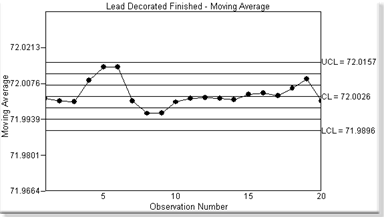
The Moving Average chart is selected on the SPC Control Properties dialog box>Chart tab.
Chart: Moving Range
Moving Range charts:
| Track | Selected characteristic value of each unit in a fixed subset. |
| Report | Difference between one point and its predecessor. |
Moving Range observation is:
- An individual unit
- Normally paired with the Individual chart to display the individual measured values.
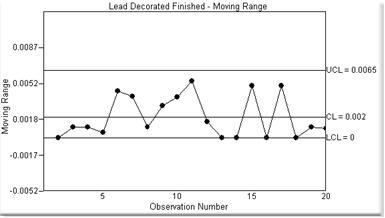
The Moving Range chart is selected on the SPC Control Properties dialog box>Chart tab.
Chart: Exponentially Weighted Moving Average (EWMA)
EWMA charts:
| Track | Selected characteristic value of each unit in a fixed subset. |
| Report | Weighted subgroup mean, the more recent the sample, the higher the weight. This detects much smaller process shifts than a normal control chart would. |
EWMA observation is a rolling, fixed size weighted subset.
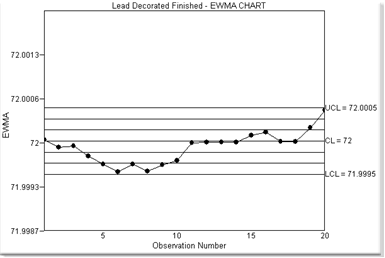
The EWMA chart is selected on the SPC Control Properties dialog box>Chart tab.
Chart: Report
Report charts display variable values in table format.
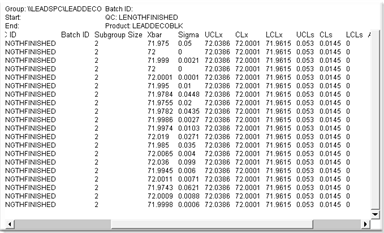
Note: Optional fields that display on the Report chart are selected on the SPC Control Properties dialog box>Report tab.


